17 Sundale Dr Roosevelt, WA 99356
Estimated payment $31,740/month
About This Home
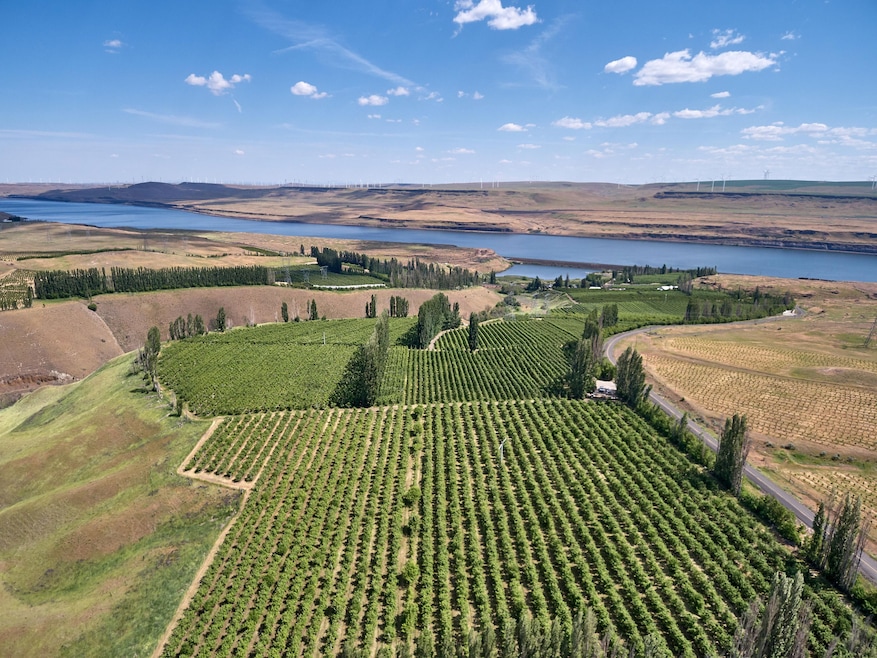
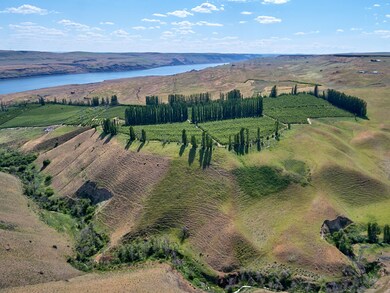
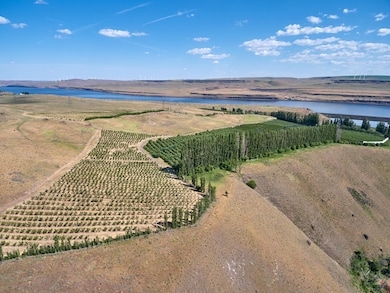
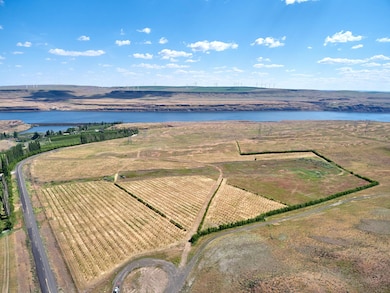
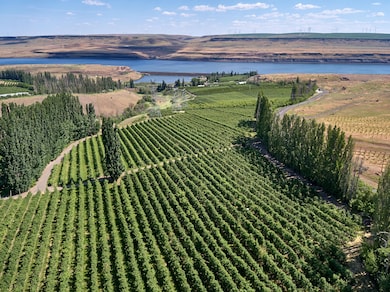
Sundale Fruit Company is comprised of approximately 334 acres adjacent to the Columbia River just west of Roosevelt WA. The acreage is planted to high-density apple, cherry and pear orchards. Elevations range from 285ft to 625ft with an early micro-climate which produces some of the earliest and most valuable fruit in the Northwest. Varietals include: Apples - Honey Crisp, Buckeye Gala, Granny Smith, and Fuji; Cherries - Bing and Coral Champagne; Pears - Bartlett and Anjou. The property features extensive housing infrastructure including a 3300 sq ft owners residence, manager's residence, foreman's residence, and numerous housing options for workers as well as H2A labor housing.
Listing Agent
Agri-Investment Services Division of Berkshire Hathaway Listed on: 09/23/2025

Home Details
Home Type
- Single Family
Est. Annual Taxes
- $8,102
Lot Details
- River Front
- Current uses include agriculture, orchard
Bedrooms and Bathrooms
- 4 Bedrooms
- 2 Full Bathrooms
Additional Features
- Water Views
- Shop
Map
Home Values in the Area
Average Home Value in this Area
Tax History
| Year | Tax Paid | Tax Assessment Tax Assessment Total Assessment is a certain percentage of the fair market value that is determined by local assessors to be the total taxable value of land and additions on the property. | Land | Improvement |
|---|---|---|---|---|
| 2025 | $8,102 | $1,354,450 | $570,750 | $783,700 |
| 2023 | $8,102 | $1,350,650 | $570,750 | $779,900 |
| 2022 | $8,073 | $1,284,150 | $570,750 | $713,400 |
| 2021 | $8,734 | $787,530 | $54,030 | $733,500 |
| 2020 | $8,734 | $798,900 | $0 | $798,900 |
| 2018 | $7,852 | $1,057,340 | $258,440 | $798,900 |
| 2017 | $6,232 | $1,005,630 | $206,730 | $798,900 |
| 2016 | $6,320 | $904,750 | $110,950 | $793,800 |
| 2015 | $4,082 | $914,550 | $110,950 | $803,600 |
| 2013 | $4,082 | $0 | $118,260 | $852,800 |
Property History
| Date | Event | Price | List to Sale | Price per Sq Ft |
|---|---|---|---|---|
| 09/23/2025 09/23/25 | For Sale | $5,900,000 | -- | -- |
- 310 Columbia Ave
- 1425 Main St
- 1275 W 1st St
- 0 Locust and Hwy 19
- 1335 Childers Rd
- 1390 Childers Rd
- 295 Krameria St
- 1275 Wright Rd
- 1555 Cottonwood St
- 440 Shane Dr
- 1585 Cottonwood St
- 111 Roosevelt Ave
- 73809 Rattlesnake Rd
- 18122 Hulden Ln
- 74207 Rhea Ln
- 0 Roosevelt Ave Unit 124636887
- 1056 Rock Creek Rd
- 68766 Weatherford Rd
- 123 Dot Rd
- 0 Oak Flat Rd Unit 1 423332096