17 Susan Ln Bellingham, MA 02019
Estimated payment $3,995/month
Highlights
- 0.92 Acre Lot
- No HOA
- Heating Available
- Corner Lot
- Ductless Heating Or Cooling System
About This Home
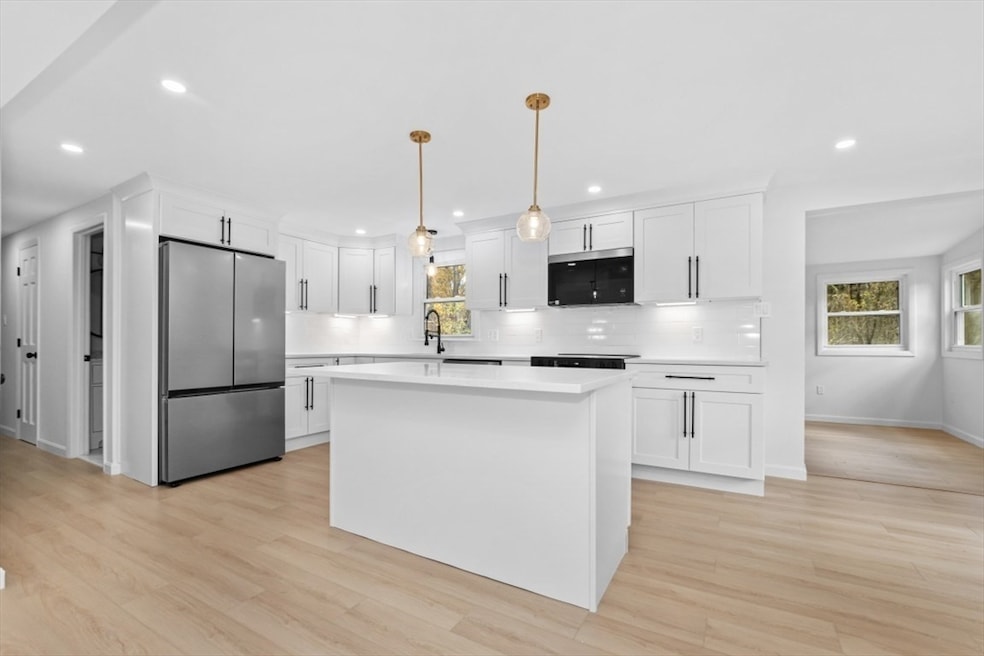
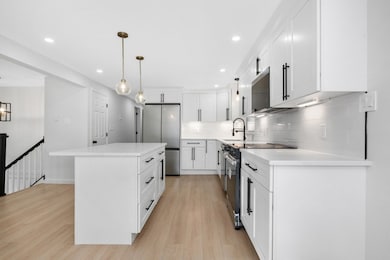
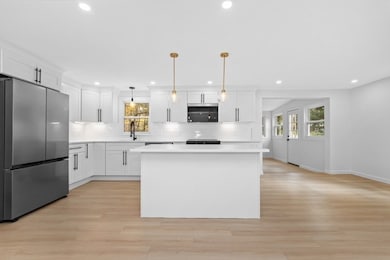
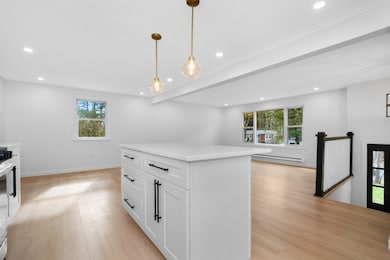
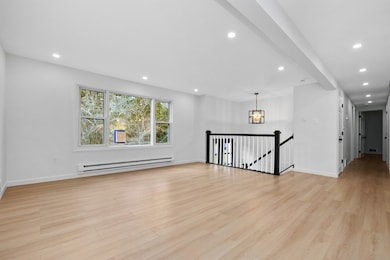
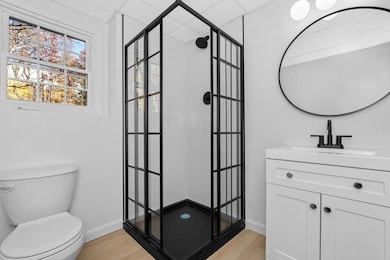
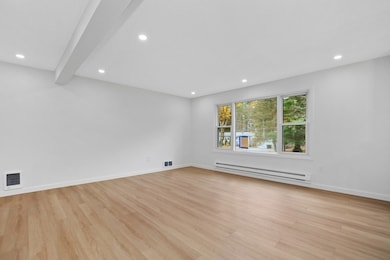
***This home qualifies for a limited-time lender-paid 2-1 buydown— reduced monthly payments for the first 2 years at no cost to the buyer. Ask listing agent for details! *** Step inside this light, bright and open fully renovated home built for entertaining and family life! Situated on a large corner lot in a quite family neighborhood, this wonderful home features gleaming new flooring and custom light fixtures, a gorgeous main living room, brand new chef's kitchen and brand new stylish baths. You'll enjoy solid quartz counter tops, custom cabinetry, stainless appliances and high end fixtures and finishes as you cook and enjoy time with family and friends in this open concept main level. The upper and lower levels are both dripping in sunlight from their oversized windows and direct access to the large, new deck, perfectly situated for grilling and expanded living and entertaining! Down stairs you'll find a finished basement with significant amount of storage space. New roof, ne
Listing Agent
Jonathan Carlson
Carlson & Company, LLC Listed on: 11/11/2025
Home Details
Home Type
- Single Family
Est. Annual Taxes
- $5,033
Year Built
- Built in 1975
Lot Details
- 0.92 Acre Lot
- Corner Lot
Parking
- 3 Car Parking Spaces
Home Design
- Split Level Home
- Concrete Perimeter Foundation
Bedrooms and Bathrooms
- 3 Bedrooms
- 3 Full Bathrooms
Utilities
- Ductless Heating Or Cooling System
- Heating Available
- Private Sewer
Additional Features
- Basement
Community Details
- No Home Owners Association
Listing and Financial Details
- Assessor Parcel Number M:0071 B:0053 L:0000,6410
Map
Home Values in the Area
Average Home Value in this Area
Tax History
| Year | Tax Paid | Tax Assessment Tax Assessment Total Assessment is a certain percentage of the fair market value that is determined by local assessors to be the total taxable value of land and additions on the property. | Land | Improvement |
|---|---|---|---|---|
| 2025 | $5,033 | $400,700 | $171,100 | $229,600 |
| 2024 | $5,156 | $400,900 | $156,200 | $244,700 |
| 2023 | $4,971 | $380,900 | $148,800 | $232,100 |
| 2022 | $4,851 | $344,500 | $124,100 | $220,400 |
| 2021 | $4,721 | $327,600 | $124,100 | $203,500 |
| 2020 | $4,550 | $320,000 | $124,100 | $195,900 |
| 2019 | $4,453 | $313,400 | $124,100 | $189,300 |
| 2018 | $4,107 | $285,000 | $119,300 | $165,700 |
| 2017 | $3,985 | $277,900 | $119,300 | $158,600 |
| 2016 | $3,800 | $265,900 | $117,300 | $148,600 |
| 2015 | $3,647 | $255,900 | $112,800 | $143,100 |
| 2014 | $3,649 | $248,900 | $110,200 | $138,700 |
Property History
| Date | Event | Price | List to Sale | Price per Sq Ft |
|---|---|---|---|---|
| 11/11/2025 11/11/25 | For Sale | $679,000 | -- | $320 / Sq Ft |
Purchase History
| Date | Type | Sale Price | Title Company |
|---|---|---|---|
| Foreclosure Deed | $405,000 | None Available | |
| Foreclosure Deed | $405,000 | None Available | |
| Deed | $43,900 | -- |
Mortgage History
| Date | Status | Loan Amount | Loan Type |
|---|---|---|---|
| Open | $350,000 | Commercial | |
| Closed | $350,000 | Commercial | |
| Previous Owner | $20,000 | No Value Available | |
| Previous Owner | $98,700 | No Value Available | |
| Previous Owner | $99,000 | No Value Available |
Source: MLS Property Information Network (MLS PIN)
MLS Number: 73453634
APN: BELL-000071-000053
Disclaimer: Certain information contained herein is derived from information provided by parties other than Homes.com. All information provided is deemed reliable, but is not guaranteed to be accurate and should be independently verified.
![]() The property listing data and information, or the Images, set forth herein were provided to MLS Property Information Network, Inc. from third party sources, including sellers, lessors and public records, and were compiled by MLS Property Information Network, Inc. The property listing data and information, and the Images, are for the personal, non-commercial use of consumers having a good faith interest in purchasing or leasing listed properties of the type displayed to them and may not be used for any purpose other than to identify prospective properties which such consumers may have a good faith interest in purchasing or leasing. MLS Property Information Network, Inc. and its subscribers disclaim any and all representations and warranties as to the accuracy of the property listing data and information, or as to the accuracy of any of the Images, set forth herein.
The property listing data and information, or the Images, set forth herein were provided to MLS Property Information Network, Inc. from third party sources, including sellers, lessors and public records, and were compiled by MLS Property Information Network, Inc. The property listing data and information, and the Images, are for the personal, non-commercial use of consumers having a good faith interest in purchasing or leasing listed properties of the type displayed to them and may not be used for any purpose other than to identify prospective properties which such consumers may have a good faith interest in purchasing or leasing. MLS Property Information Network, Inc. and its subscribers disclaim any and all representations and warranties as to the accuracy of the property listing data and information, or as to the accuracy of any of the Images, set forth herein.
- 950 S Main St
- 1001 Old Bridge Ln Unit 1001A
- 1109 S Main St Unit 1111
- 1 Blackstone St
- 161 Mechanic St
- 10 Essex St Unit 2
- 50 Woodview Way
- 643 Rathbun St Unit 3
- 643 Rathbun St Unit 643 Rathbun St #3
- 104 Mill St
- 106 Mill St Unit 202
- 104 Mill St Unit 103
- 183 Walnut Hill Rd Unit Left Side
- 518 Privilege St Unit 3
- 115 N Main St
- 120 Mill St Unit 302
- 665 Mendon Rd Unit FL2-ID1347759P
- 217 Rathbun St Unit 2
- 34 Rutland St Unit 2
- 151 N Main St
