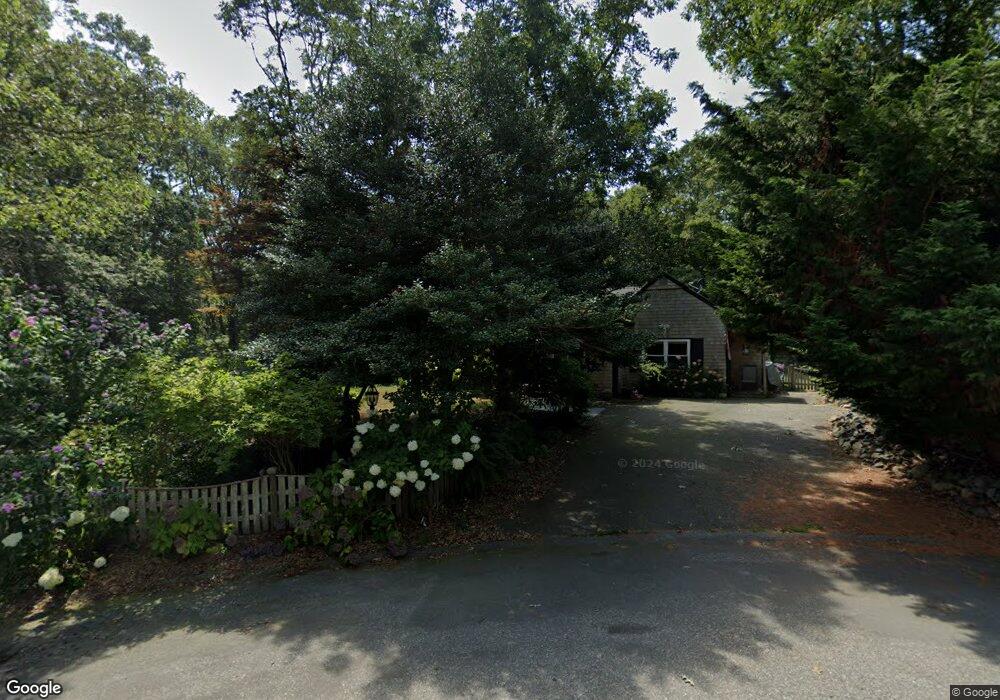
17 Sweetfern Ln Harwich, MA 02645
Northwest Harwich NeighborhoodEstimated Value: $691,000 - $777,000
3
Beds
2
Baths
1,501
Sq Ft
$491/Sq Ft
Est. Value
About This Home
This home is located at 17 Sweetfern Ln, Harwich, MA 02645 and is currently estimated at $737,417, approximately $491 per square foot. 17 Sweetfern Ln is a home located in Barnstable County with nearby schools including Harwich Elementary School, Chatham Elementary School, and Monomoy Regional Middle School.
Ownership History
Date
Name
Owned For
Owner Type
Purchase Details
Closed on
May 20, 2008
Sold by
Segal Alan and Segal Barbara P
Bought by
Barbara Pierce Segal L and Segal Barbara Pierce
Current Estimated Value
Purchase Details
Closed on
Apr 15, 1997
Sold by
Gray Harry L and Gray Phyllis
Bought by
Segal Alan and Segal Barbara P
Home Financials for this Owner
Home Financials are based on the most recent Mortgage that was taken out on this home.
Original Mortgage
$108,000
Interest Rate
7.55%
Mortgage Type
Purchase Money Mortgage
Create a Home Valuation Report for This Property
The Home Valuation Report is an in-depth analysis detailing your home's value as well as a comparison with similar homes in the area
Home Values in the Area
Average Home Value in this Area
Purchase History
| Date | Buyer | Sale Price | Title Company |
|---|---|---|---|
| Barbara Pierce Segal L | -- | -- | |
| Segal Alan | $135,000 | -- |
Source: Public Records
Mortgage History
| Date | Status | Borrower | Loan Amount |
|---|---|---|---|
| Open | Segal Alan | $80,000 | |
| Previous Owner | Segal Alan | $75,000 | |
| Previous Owner | Segal Alan | $108,000 |
Source: Public Records
Tax History Compared to Growth
Tax History
| Year | Tax Paid | Tax Assessment Tax Assessment Total Assessment is a certain percentage of the fair market value that is determined by local assessors to be the total taxable value of land and additions on the property. | Land | Improvement |
|---|---|---|---|---|
| 2025 | $3,855 | $652,200 | $156,500 | $495,700 |
| 2024 | $3,745 | $621,100 | $147,600 | $473,500 |
| 2023 | $3,681 | $554,300 | $134,200 | $420,100 |
| 2022 | $3,731 | $460,000 | $140,100 | $319,900 |
| 2021 | $3,642 | $423,500 | $127,300 | $296,200 |
| 2020 | $3,557 | $407,400 | $119,600 | $287,800 |
| 2019 | $3,323 | $383,300 | $115,000 | $268,300 |
| 2018 | $3,408 | $376,000 | $104,500 | $271,500 |
| 2017 | $3,133 | $349,300 | $95,200 | $254,100 |
| 2016 | $3,068 | $338,300 | $95,200 | $243,100 |
| 2015 | $2,911 | $324,500 | $88,400 | $236,100 |
| 2014 | $2,661 | $303,400 | $71,500 | $231,900 |
Source: Public Records
Map
Nearby Homes
- 6 Sassafras Ln
- 3 Bittersweet Ln
- 3 Bentley Rd
- 16 Long Pond Dr
- 14 2nd St
- 52 Bettys Ln
- 120 Red Maple Rd
- 159 Pleasant Lake Ave
- 25 Black Duck Cartway
- 2 Bassett Woods Rd
- 21 Nancys Way
- 728 Great Fields Rd
- 597 Great Fields Rd
- 11 Windjammer Rd
- 12 Old Campground Rd
- 18 Old Campground
- 116 Parallel St
- 13 Harwich Pines