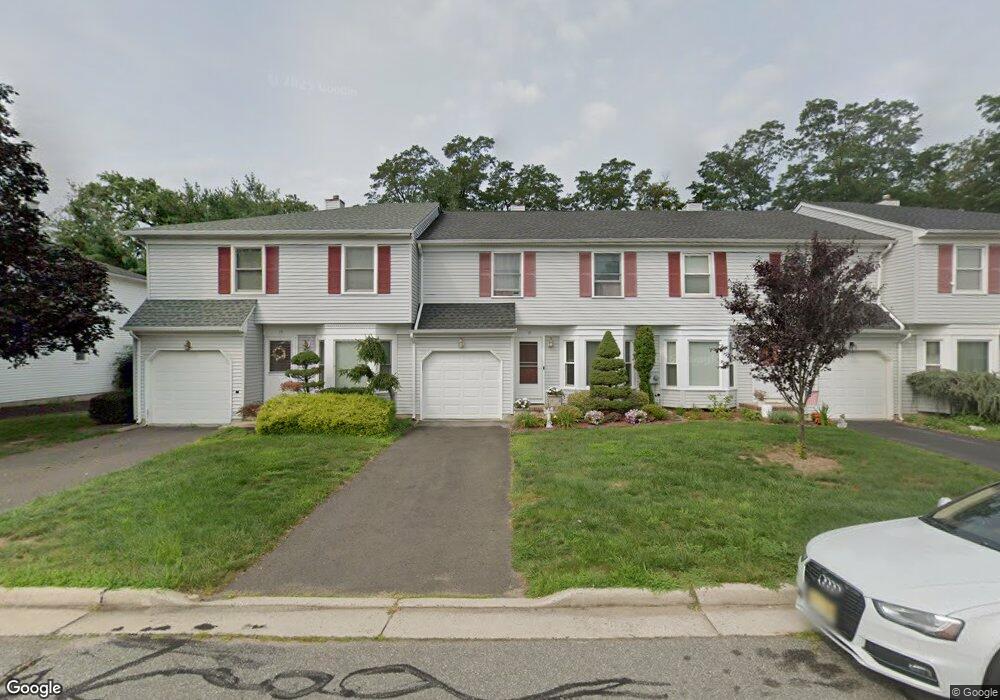
17 Sycamore Rd Middlesex, NJ 08846
Estimated Value: $441,000 - $506,000
2
Beds
3
Baths
--
Sq Ft
3,267
Sq Ft Lot
About This Home
This home is located at 17 Sycamore Rd, Middlesex, NJ 08846 and is currently estimated at $458,609. 17 Sycamore Rd is a home located in Middlesex County with nearby schools including Middlesex High School and Our Lady of Mount Virgin School.
Ownership History
Date
Name
Owned For
Owner Type
Purchase Details
Closed on
Jun 7, 2006
Sold by
Natale Santo Carmelo
Bought by
Russo Sally
Current Estimated Value
Home Financials for this Owner
Home Financials are based on the most recent Mortgage that was taken out on this home.
Original Mortgage
$100,000
Outstanding Balance
$58,956
Interest Rate
6.62%
Estimated Equity
$399,653
Purchase Details
Closed on
Jun 29, 2001
Sold by
Mullis Wiliam
Bought by
Natale Santo and Natale Mariaconcetta Marino
Home Financials for this Owner
Home Financials are based on the most recent Mortgage that was taken out on this home.
Original Mortgage
$138,400
Interest Rate
7.1%
Create a Home Valuation Report for This Property
The Home Valuation Report is an in-depth analysis detailing your home's value as well as a comparison with similar homes in the area
Home Values in the Area
Average Home Value in this Area
Purchase History
| Date | Buyer | Sale Price | Title Company |
|---|---|---|---|
| Russo Sally | $315,000 | -- | |
| Natale Santo | $173,000 | -- |
Source: Public Records
Mortgage History
| Date | Status | Borrower | Loan Amount |
|---|---|---|---|
| Open | Russo Sally | $100,000 | |
| Previous Owner | Natale Santo | $138,400 |
Source: Public Records
Tax History Compared to Growth
Tax History
| Year | Tax Paid | Tax Assessment Tax Assessment Total Assessment is a certain percentage of the fair market value that is determined by local assessors to be the total taxable value of land and additions on the property. | Land | Improvement |
|---|---|---|---|---|
| 2025 | $7,294 | $363,600 | $88,200 | $275,400 |
| 2024 | $6,944 | $315,200 | $88,200 | $227,000 |
| 2023 | $6,944 | $315,200 | $88,200 | $227,000 |
| 2022 | $7,933 | $80,200 | $20,000 | $60,200 |
| 2021 | $5,411 | $80,200 | $20,000 | $60,200 |
| 2020 | $7,556 | $80,200 | $20,000 | $60,200 |
| 2019 | $7,352 | $80,200 | $20,000 | $60,200 |
| 2018 | $7,129 | $80,200 | $20,000 | $60,200 |
| 2017 | $6,932 | $80,200 | $20,000 | $60,200 |
| 2016 | $6,804 | $81,400 | $20,000 | $61,400 |
| 2015 | $6,660 | $81,400 | $20,000 | $61,400 |
| 2014 | $6,533 | $81,400 | $20,000 | $61,400 |
Source: Public Records
Map
Nearby Homes