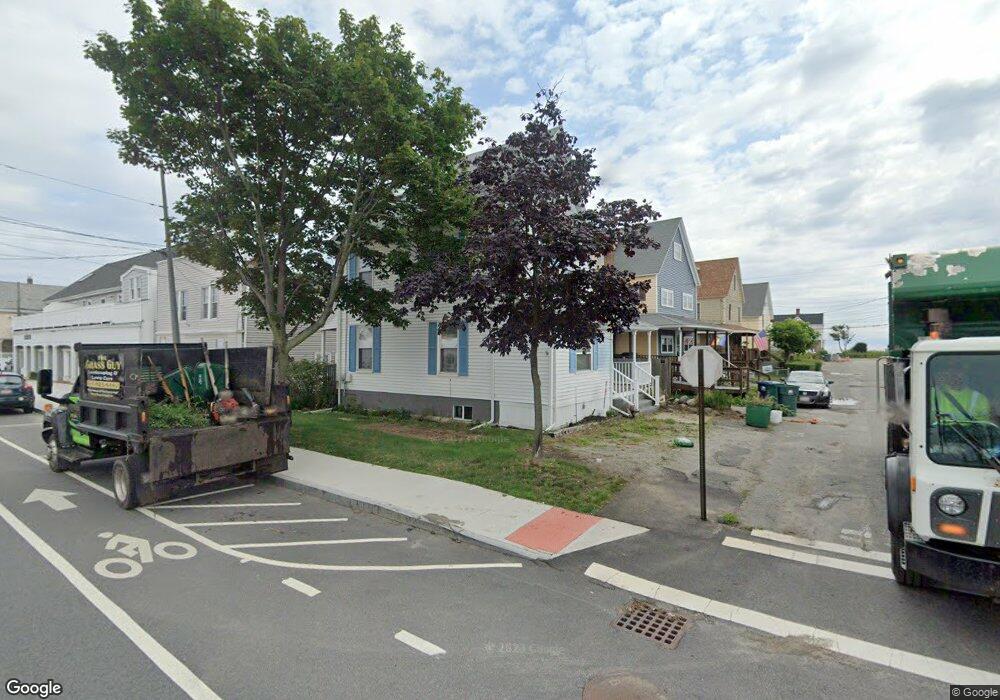
17 T St Hull, MA 02045
The Alphabets NeighborhoodEstimated Value: $558,000 - $614,000
3
Beds
2
Baths
1,408
Sq Ft
$417/Sq Ft
Est. Value
About This Home
This home is located at 17 T St, Hull, MA 02045 and is currently estimated at $587,413, approximately $417 per square foot. 17 T St is a home located in Plymouth County with nearby schools including Lillian M. Jacobs Elementary School, Memorial Middle School, and Hull High School.
Ownership History
Date
Name
Owned For
Owner Type
Purchase Details
Closed on
Oct 7, 2011
Sold by
Jp Morgan Mtg Acquisit
Bought by
Regan Rebecca A and Regan Russell F
Current Estimated Value
Purchase Details
Closed on
Feb 17, 2011
Sold by
Gorman Joni and Gorman Dennis
Bought by
Jp Morgan Mtg Acquis C
Purchase Details
Closed on
Nov 16, 2006
Sold by
Gorman Dennis
Bought by
Gorman Dennis and Gorman Joni
Home Financials for this Owner
Home Financials are based on the most recent Mortgage that was taken out on this home.
Original Mortgage
$315,000
Interest Rate
6.33%
Mortgage Type
Purchase Money Mortgage
Purchase Details
Closed on
Apr 28, 2006
Sold by
Gorman Dennis and Gorman Joni L
Bought by
Gorman Dennis
Home Financials for this Owner
Home Financials are based on the most recent Mortgage that was taken out on this home.
Original Mortgage
$262,650
Interest Rate
6.4%
Mortgage Type
Purchase Money Mortgage
Purchase Details
Closed on
Nov 2, 2005
Sold by
Gorman Michael A
Bought by
Gorman Dennis
Create a Home Valuation Report for This Property
The Home Valuation Report is an in-depth analysis detailing your home's value as well as a comparison with similar homes in the area
Home Values in the Area
Average Home Value in this Area
Purchase History
| Date | Buyer | Sale Price | Title Company |
|---|---|---|---|
| Regan Rebecca A | $94,000 | -- | |
| Jp Morgan Mtg Acquis C | $170,000 | -- | |
| Gorman Dennis | -- | -- | |
| Gorman Dennis | -- | -- | |
| Gorman Dennis | $309,000 | -- |
Source: Public Records
Mortgage History
| Date | Status | Borrower | Loan Amount |
|---|---|---|---|
| Previous Owner | Gorman Dennis | $351,650 | |
| Previous Owner | Gorman Dennis | $315,000 | |
| Previous Owner | Gorman Dennis | $262,650 |
Source: Public Records
Tax History
| Year | Tax Paid | Tax Assessment Tax Assessment Total Assessment is a certain percentage of the fair market value that is determined by local assessors to be the total taxable value of land and additions on the property. | Land | Improvement |
|---|---|---|---|---|
| 2025 | $5,920 | $528,600 | $272,900 | $255,700 |
| 2024 | $5,576 | $478,600 | $251,900 | $226,700 |
| 2023 | $5,147 | $422,900 | $209,900 | $213,000 |
| 2022 | $5,202 | $414,800 | $199,400 | $215,400 |
| 2021 | $4,432 | $349,500 | $199,400 | $150,100 |
| 2020 | $4,508 | $351,600 | $199,400 | $152,200 |
| 2019 | $4,202 | $322,000 | $178,400 | $143,600 |
| 2018 | $4,147 | $309,000 | $178,400 | $130,600 |
| 2017 | $4,333 | $315,800 | $178,400 | $137,400 |
| 2016 | $4,257 | $315,800 | $178,400 | $137,400 |
| 2015 | $4,110 | $294,800 | $157,400 | $137,400 |
| 2014 | $4,065 | $293,100 | $157,400 | $135,700 |
Source: Public Records
Map
Nearby Homes
- 17 T St
- 17 T St Unit 9 month
- 17 T Street Summer Mos Unit 1 month
- 17 T St
- 17 T St Unit 1 month
- 17 T St Unit July&Aug
- 17 T St Unit Spt 17-june
- 17 T St Unit Summer
- 818 Nantasket Ave Unit 1,2,3
- 818 Nantasket Ave
- 19 T St
- 23 T St
- 822 Nantasket Ave
- 822 Nantasket Ave Unit 2
- 822 Nantasket Ave Unit 1
- 822 Nantasket Ave Unit 3
- 822 Nantasket Ave Unit 4
- 16 U St
- 16 U St Unit house
- 22 T St
Your Personal Tour Guide
Ask me questions while you tour the home.