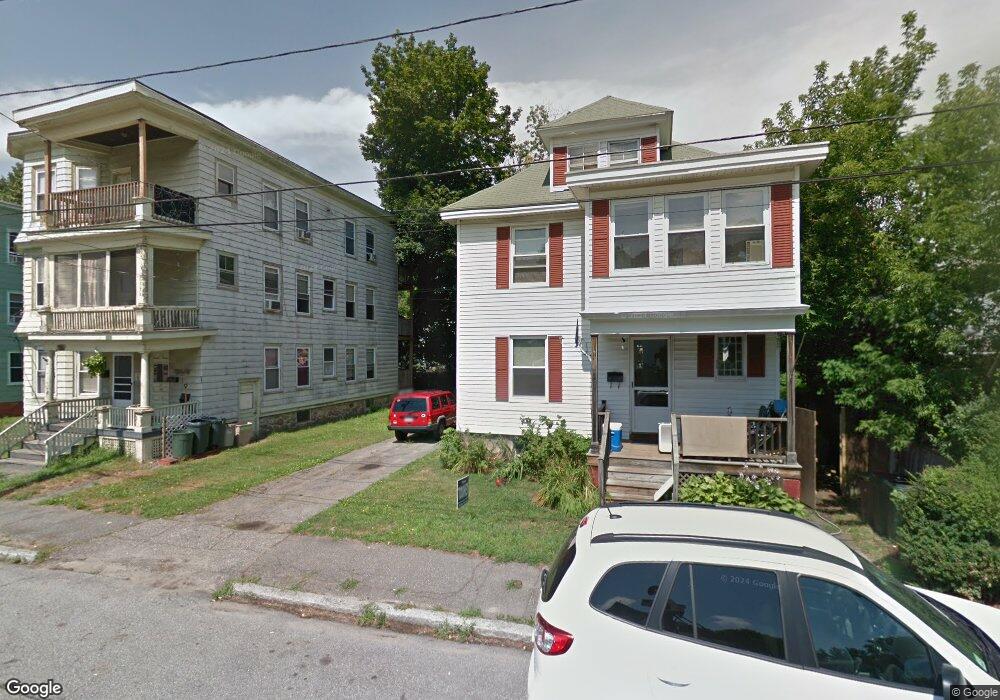
17 Taft Ave Unit 19 Haverhill, MA 01830
Walnut Square NeighborhoodEstimated Value: $618,051 - $815,000
4
Beds
2
Baths
2,528
Sq Ft
$275/Sq Ft
Est. Value
About This Home
This home is located at 17 Taft Ave Unit 19, Haverhill, MA 01830 and is currently estimated at $696,013, approximately $275 per square foot. 17 Taft Ave Unit 19 is a home located in Essex County with nearby schools including Pentucket Lake Elementary School and Haverhill High School.
Ownership History
Date
Name
Owned For
Owner Type
Purchase Details
Closed on
Feb 28, 2014
Sold by
Holland Kevin
Bought by
Karen Holland Ret and Morse Christine L
Current Estimated Value
Purchase Details
Closed on
Dec 5, 2013
Sold by
Holland Karen
Bought by
Karen Holland Ret
Purchase Details
Closed on
Jul 27, 2001
Sold by
Mandez Fausto E and Mendez Marilyn
Bought by
Holland Kevin and Holland Karen
Home Financials for this Owner
Home Financials are based on the most recent Mortgage that was taken out on this home.
Original Mortgage
$154,800
Interest Rate
7.18%
Mortgage Type
Purchase Money Mortgage
Purchase Details
Closed on
Aug 29, 1997
Sold by
Fnma
Bought by
Mendez Fausto E and Mendez Marilyn
Purchase Details
Closed on
Oct 19, 1989
Sold by
Taft Ave Rt
Bought by
Comeau Jeffrey
Purchase Details
Closed on
Aug 3, 1989
Sold by
Healy Joan
Bought by
Taft Ave Rt
Create a Home Valuation Report for This Property
The Home Valuation Report is an in-depth analysis detailing your home's value as well as a comparison with similar homes in the area
Home Values in the Area
Average Home Value in this Area
Purchase History
| Date | Buyer | Sale Price | Title Company |
|---|---|---|---|
| Karen Holland Ret | -- | -- | |
| Karen Holland Ret | -- | -- | |
| Holland Kevin | $193,500 | -- | |
| Mendez Fausto E | $93,750 | -- | |
| Comeau Jeffrey | $166,000 | -- | |
| Taft Ave Rt | $110,000 | -- |
Source: Public Records
Mortgage History
| Date | Status | Borrower | Loan Amount |
|---|---|---|---|
| Previous Owner | Taft Ave Rt | $186,000 | |
| Previous Owner | Taft Ave Rt | $154,800 |
Source: Public Records
Tax History Compared to Growth
Tax History
| Year | Tax Paid | Tax Assessment Tax Assessment Total Assessment is a certain percentage of the fair market value that is determined by local assessors to be the total taxable value of land and additions on the property. | Land | Improvement |
|---|---|---|---|---|
| 2025 | $5,961 | $556,600 | $142,100 | $414,500 |
| 2024 | $5,513 | $518,100 | $140,600 | $377,500 |
| 2023 | $5,178 | $464,400 | $128,700 | $335,700 |
| 2022 | $4,952 | $389,300 | $116,700 | $272,600 |
| 2021 | $4,639 | $345,200 | $101,700 | $243,500 |
| 2020 | $4,409 | $324,200 | $94,300 | $229,900 |
| 2019 | $4,085 | $292,800 | $82,300 | $210,500 |
| 2018 | $3,890 | $272,800 | $77,800 | $195,000 |
| 2017 | $3,283 | $219,000 | $62,800 | $156,200 |
| 2016 | $3,521 | $229,200 | $62,800 | $166,400 |
| 2015 | $3,262 | $212,500 | $62,800 | $149,700 |
Source: Public Records
Map
Nearby Homes
- 16 Dudley St
- 434 Main St
- 16 Fountain St
- 21 7th Ave
- 34 7th Ave
- 33 Hamilton Ave
- 25-27 Dover St
- 100 Lawrence St Unit 5
- 6 Dexter St
- 192 Franklin St
- 20 Ashland St
- 151 Franklin St
- 70 Brockton Ave
- 23 Arlington St
- 13-15 Arlington St
- 17 Arlington St
- 5 Kimball St
- 10 Westland Terrace
- 7 Clinton St Unit 4
- 48 Portland St