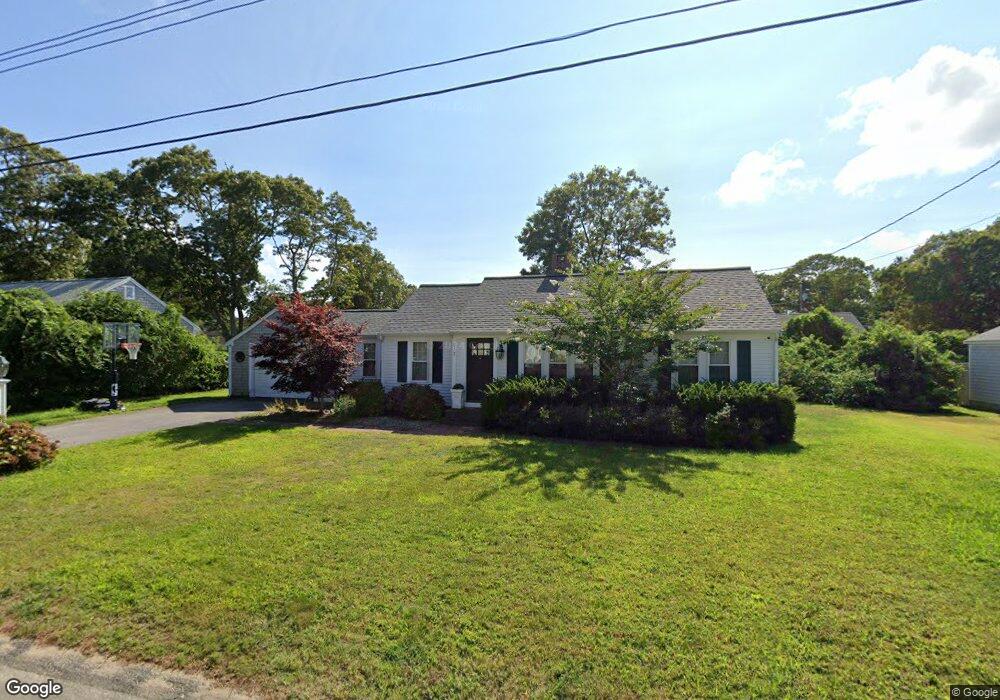
17 Terry Rd West Dennis, MA 02670
West Dennis NeighborhoodEstimated Value: $790,000 - $821,888
3
Beds
2
Baths
1,192
Sq Ft
$677/Sq Ft
Est. Value
About This Home
This home is located at 17 Terry Rd, West Dennis, MA 02670 and is currently estimated at $806,972, approximately $676 per square foot. 17 Terry Rd is a home located in Barnstable County with nearby schools including Dennis-Yarmouth Regional High School and St. Pius X. School.
Ownership History
Date
Name
Owned For
Owner Type
Purchase Details
Closed on
Feb 6, 2015
Sold by
Dean Susan J and Dean Charles A
Bought by
Mahoney 3Rd Walter J
Current Estimated Value
Purchase Details
Closed on
May 9, 2014
Sold by
Hood Robert E and Hood Joan E
Bought by
Dean Susan J and Dean Charles A
Purchase Details
Closed on
Nov 30, 2007
Sold by
Apollo Int and Apollo Grady
Bought by
Snow James F and Snow Lea G
Purchase Details
Closed on
May 28, 1993
Sold by
Neylon Francis X and Neylon Elizabeth A
Bought by
Hood Robert E and Hood Joan E
Create a Home Valuation Report for This Property
The Home Valuation Report is an in-depth analysis detailing your home's value as well as a comparison with similar homes in the area
Home Values in the Area
Average Home Value in this Area
Purchase History
| Date | Buyer | Sale Price | Title Company |
|---|---|---|---|
| Mahoney 3Rd Walter J | $418,000 | -- | |
| Dean Susan J | $260,000 | -- | |
| Snow James F | $180,000 | -- | |
| Snow James F | $180,000 | -- | |
| Hood Robert E | $106,000 | -- | |
| Hood Robert E | $106,000 | -- |
Source: Public Records
Mortgage History
| Date | Status | Borrower | Loan Amount |
|---|---|---|---|
| Closed | Mahoney 3Rd Walter J | $0 |
Source: Public Records
Tax History Compared to Growth
Tax History
| Year | Tax Paid | Tax Assessment Tax Assessment Total Assessment is a certain percentage of the fair market value that is determined by local assessors to be the total taxable value of land and additions on the property. | Land | Improvement |
|---|---|---|---|---|
| 2025 | $3,513 | $811,400 | $220,400 | $591,000 |
| 2024 | $3,350 | $763,000 | $211,900 | $551,100 |
| 2023 | $3,240 | $693,800 | $192,700 | $501,100 |
| 2022 | $2,922 | $521,700 | $150,400 | $371,300 |
| 2021 | $2,789 | $462,600 | $147,500 | $315,100 |
| 2020 | $2,699 | $442,400 | $158,800 | $283,600 |
| 2019 | $2,734 | $443,100 | $166,800 | $276,300 |
| 2018 | $2,512 | $396,200 | $148,200 | $248,000 |
| 2017 | $2,389 | $388,400 | $148,200 | $240,200 |
| 2016 | $2,293 | $351,200 | $153,500 | $197,700 |
| 2015 | $1,571 | $245,400 | $153,500 | $91,900 |
| 2014 | $1,593 | $250,800 | $153,500 | $97,300 |
Source: Public Records
Map
Nearby Homes
- 61 Trotters Ln
- 15 Woodside Park Rd
- 467 Main St
- 401 Main St Unit 201
- 401 Main St Unit 101
- 12 Spoonbill Rd
- 3 Pinefield Ln
- 178 School St
- 26 Center St
- 80 Michaels Ave
- 23 Doric Ave
- 6 Baker Way
- 95 Center St
- 71 Main St
- 14 Schoolhouse Ln
- 209 Main St Unit 3
- 209 Main St Unit 6
- 209 Main St Unit 1
- 209 Main St Unit 2
- 209 Main St Unit 4