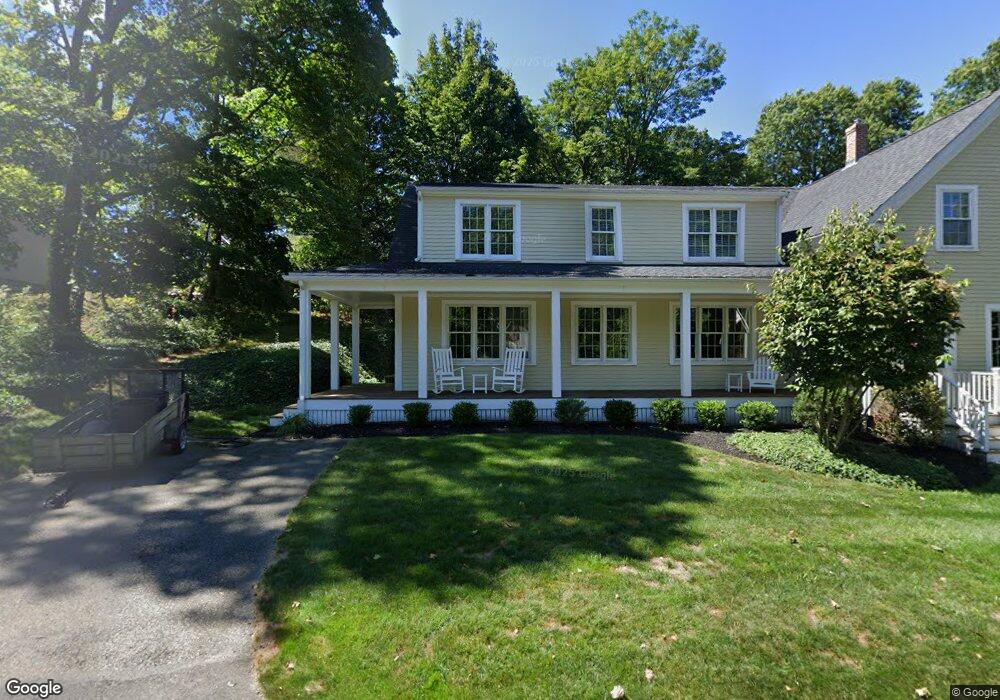
17 Thayer St Hingham, MA 02043
Estimated Value: $1,647,000 - $2,131,000
5
Beds
4
Baths
4,200
Sq Ft
$435/Sq Ft
Est. Value
About This Home
This home is located at 17 Thayer St, Hingham, MA 02043 and is currently estimated at $1,828,514, approximately $435 per square foot. 17 Thayer St is a home located in Plymouth County with nearby schools including William L. Foster Elementary School, Hingham Middle School, and Hingham High School.
Ownership History
Date
Name
Owned For
Owner Type
Purchase Details
Closed on
May 12, 2020
Sold by
Stephen J Magliaccio Ret
Bought by
Migliaccio Stephen J and Migliaccio Helen
Current Estimated Value
Home Financials for this Owner
Home Financials are based on the most recent Mortgage that was taken out on this home.
Original Mortgage
$400,000
Outstanding Balance
$351,334
Interest Rate
3.3%
Mortgage Type
New Conventional
Estimated Equity
$1,477,180
Purchase Details
Closed on
Dec 16, 2014
Sold by
Migliaccio Stephen J and Migliaccio E H
Bought by
Stephen J Migliaccio R
Purchase Details
Closed on
Jul 29, 2004
Sold by
Anastos Richard G and Anastos Karen L
Bought by
Migliaccio Stephen J and Elisabeth Migliaccio H
Create a Home Valuation Report for This Property
The Home Valuation Report is an in-depth analysis detailing your home's value as well as a comparison with similar homes in the area
Purchase History
| Date | Buyer | Sale Price | Title Company |
|---|---|---|---|
| Migliaccio Stephen J | -- | None Available | |
| Stephen J Migliaccio R | -- | -- | |
| Migliaccio Stephen J | $675,000 | -- |
Source: Public Records
Mortgage History
| Date | Status | Borrower | Loan Amount |
|---|---|---|---|
| Open | Migliaccio Stephen J | $400,000 | |
| Previous Owner | Migliaccio Stephen J | $378,000 |
Source: Public Records
Tax History
| Year | Tax Paid | Tax Assessment Tax Assessment Total Assessment is a certain percentage of the fair market value that is determined by local assessors to be the total taxable value of land and additions on the property. | Land | Improvement |
|---|---|---|---|---|
| 2025 | $13,092 | $1,224,700 | $477,800 | $746,900 |
| 2024 | $13,109 | $1,208,200 | $477,800 | $730,400 |
| 2023 | $11,850 | $1,185,000 | $477,800 | $707,200 |
| 2022 | $11,407 | $986,800 | $398,200 | $588,600 |
| 2021 | $11,370 | $963,600 | $398,200 | $565,400 |
| 2020 | $11,110 | $963,600 | $398,200 | $565,400 |
| 2019 | $9,822 | $831,700 | $398,200 | $433,500 |
| 2018 | $9,595 | $815,200 | $398,200 | $417,000 |
| 2017 | $9,265 | $756,300 | $396,700 | $359,600 |
| 2016 | $9,135 | $731,400 | $377,900 | $353,500 |
| 2015 | $7,988 | $637,500 | $360,000 | $277,500 |
Source: Public Records
Map
Nearby Homes
Your Personal Tour Guide
Ask me questions while you tour the home.