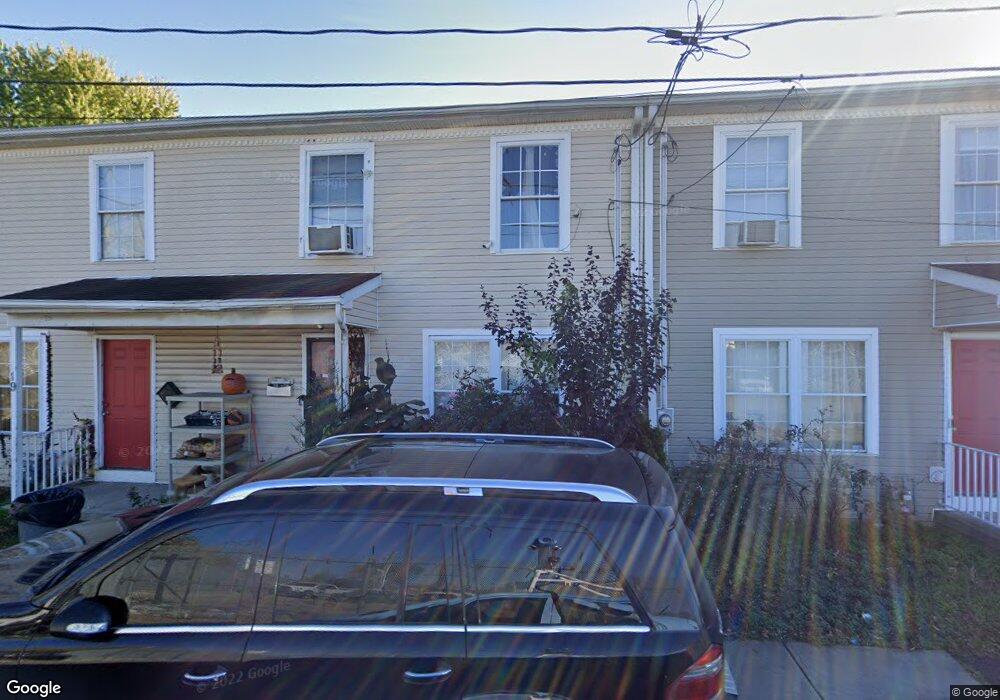
17 Thompson St Trenton, NJ 08609
Greenwood & Hamilton NeighborhoodEstimated Value: $184,999 - $264,000
--
Bed
--
Bath
1,280
Sq Ft
$165/Sq Ft
Est. Value
About This Home
This home is located at 17 Thompson St, Trenton, NJ 08609 and is currently estimated at $211,750, approximately $165 per square foot. 17 Thompson St is a home located in Mercer County with nearby schools including P.J. Hill Elementary School, Grant Elementary School, and Dr. Martin Luther King Middle School.
Ownership History
Date
Name
Owned For
Owner Type
Purchase Details
Closed on
Mar 8, 2018
Sold by
The City Of Prenton
Bought by
Barlow Robert
Current Estimated Value
Purchase Details
Closed on
Dec 14, 1998
Sold by
Better Community Housing
Bought by
Ubah Sylvia Smith
Home Financials for this Owner
Home Financials are based on the most recent Mortgage that was taken out on this home.
Original Mortgage
$21,000
Interest Rate
6.74%
Purchase Details
Closed on
Mar 21, 1997
Sold by
Tucker Beryl Ann
Bought by
City Of Trenton
Create a Home Valuation Report for This Property
The Home Valuation Report is an in-depth analysis detailing your home's value as well as a comparison with similar homes in the area
Home Values in the Area
Average Home Value in this Area
Purchase History
| Date | Buyer | Sale Price | Title Company |
|---|---|---|---|
| Barlow Robert | $4,000 | Sterling Title Agency | |
| Ubah Sylvia Smith | $21,000 | -- | |
| City Of Trenton | $8,000 | -- |
Source: Public Records
Mortgage History
| Date | Status | Borrower | Loan Amount |
|---|---|---|---|
| Previous Owner | Ubah Sylvia Smith | $21,000 |
Source: Public Records
Tax History Compared to Growth
Tax History
| Year | Tax Paid | Tax Assessment Tax Assessment Total Assessment is a certain percentage of the fair market value that is determined by local assessors to be the total taxable value of land and additions on the property. | Land | Improvement |
|---|---|---|---|---|
| 2025 | $3,272 | $56,400 | $5,800 | $50,600 |
| 2024 | $3,140 | $56,400 | $5,800 | $50,600 |
| 2023 | $3,140 | $56,400 | $5,800 | $50,600 |
| 2022 | $3,078 | $56,400 | $5,800 | $50,600 |
| 2021 | $3,132 | $56,400 | $5,800 | $50,600 |
| 2020 | $3,122 | $56,400 | $5,800 | $50,600 |
| 2019 | $3,072 | $56,400 | $5,800 | $50,600 |
| 2018 | $2,940 | $56,400 | $5,800 | $50,600 |
| 2017 | $2,795 | $56,400 | $5,800 | $50,600 |
| 2016 | $1,208 | $21,000 | $6,000 | $15,000 |
| 2015 | $1,204 | $21,000 | $6,000 | $15,000 |
| 2014 | $1,198 | $21,000 | $6,000 | $15,000 |
Source: Public Records
Map
Nearby Homes