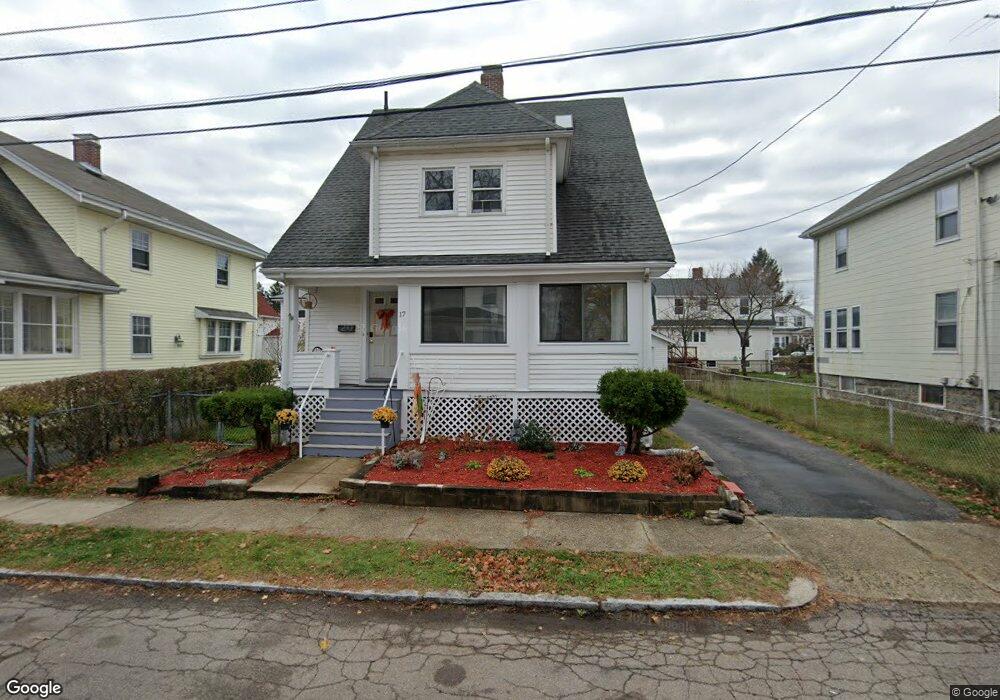
17 Thornton St Quincy, MA 02170
Wollaston NeighborhoodEstimated Value: $740,000 - $881,000
4
Beds
3
Baths
1,561
Sq Ft
$509/Sq Ft
Est. Value
About This Home
This home is located at 17 Thornton St, Quincy, MA 02170 and is currently estimated at $794,672, approximately $509 per square foot. 17 Thornton St is a home located in Norfolk County with nearby schools including Beechwood Knoll Elementary School, Central Middle School, and North Quincy High School.
Ownership History
Date
Name
Owned For
Owner Type
Purchase Details
Closed on
May 23, 1989
Sold by
Clark Shirley A
Bought by
Lee Chui H
Current Estimated Value
Home Financials for this Owner
Home Financials are based on the most recent Mortgage that was taken out on this home.
Original Mortgage
$147,200
Interest Rate
10.97%
Mortgage Type
Purchase Money Mortgage
Create a Home Valuation Report for This Property
The Home Valuation Report is an in-depth analysis detailing your home's value as well as a comparison with similar homes in the area
Home Values in the Area
Average Home Value in this Area
Purchase History
| Date | Buyer | Sale Price | Title Company |
|---|---|---|---|
| Lee Chui H | $184,000 | -- |
Source: Public Records
Mortgage History
| Date | Status | Borrower | Loan Amount |
|---|---|---|---|
| Open | Lee Chui H | $100,000 | |
| Closed | Lee Chui H | $147,200 |
Source: Public Records
Tax History Compared to Growth
Tax History
| Year | Tax Paid | Tax Assessment Tax Assessment Total Assessment is a certain percentage of the fair market value that is determined by local assessors to be the total taxable value of land and additions on the property. | Land | Improvement |
|---|---|---|---|---|
| 2025 | $7,340 | $636,600 | $315,300 | $321,300 |
| 2024 | $7,039 | $624,600 | $315,300 | $309,300 |
| 2023 | $6,607 | $593,600 | $300,300 | $293,300 |
| 2022 | $6,399 | $534,100 | $240,200 | $293,900 |
| 2021 | $6,034 | $497,000 | $240,200 | $256,800 |
| 2020 | $5,950 | $478,700 | $240,200 | $238,500 |
| 2019 | $5,759 | $458,900 | $224,500 | $234,400 |
| 2018 | $5,281 | $395,900 | $204,100 | $191,800 |
| 2017 | $5,416 | $382,200 | $204,100 | $178,100 |
| 2016 | $5,046 | $351,400 | $185,500 | $165,900 |
| 2015 | $4,688 | $321,100 | $168,700 | $152,400 |
| 2014 | $4,572 | $307,700 | $160,600 | $147,100 |
Source: Public Records
Map
Nearby Homes
- 72 Waterston Ave
- 123 Waterston Ave
- 100 Thornton St
- 14 Ridgeway St
- 35 Estabrook Rd
- 22 Beach St
- 101 Beach St
- 65 - 67 Davis St
- 163 Clay St Unit C
- 41 Randlett St
- 22 Newton Ave
- 55 Warren Ave
- 43 Ellington Rd
- 158 W Elm Ave
- 365 Newport Ave Unit 301
- 165 Old Colony Ave Unit A
- 111 Warren Ave Unit 1F
- 29 Oval Rd
- 522 Hancock St
- 129 Beale St
- 21 Thornton St
- 15 Thornton St
- 168 Marlboro St
- 174 Marlboro St
- 164 Marlboro St
- 164 Marlboro St Unit 1
- 164 Marlboro St Unit SF
- 164 Marlboro St Unit House
- 9 Thornton St
- 25 Thornton St
- 18 Thornton St
- 12 Thornton St
- 176 Marlboro St
- 160 Marlboro St
- 22 Thornton St
- 29 Thornton St
- 29 Thornton St Unit 1
- 26 Thornton St
- 180 Marlboro St
- 1 Thornton St