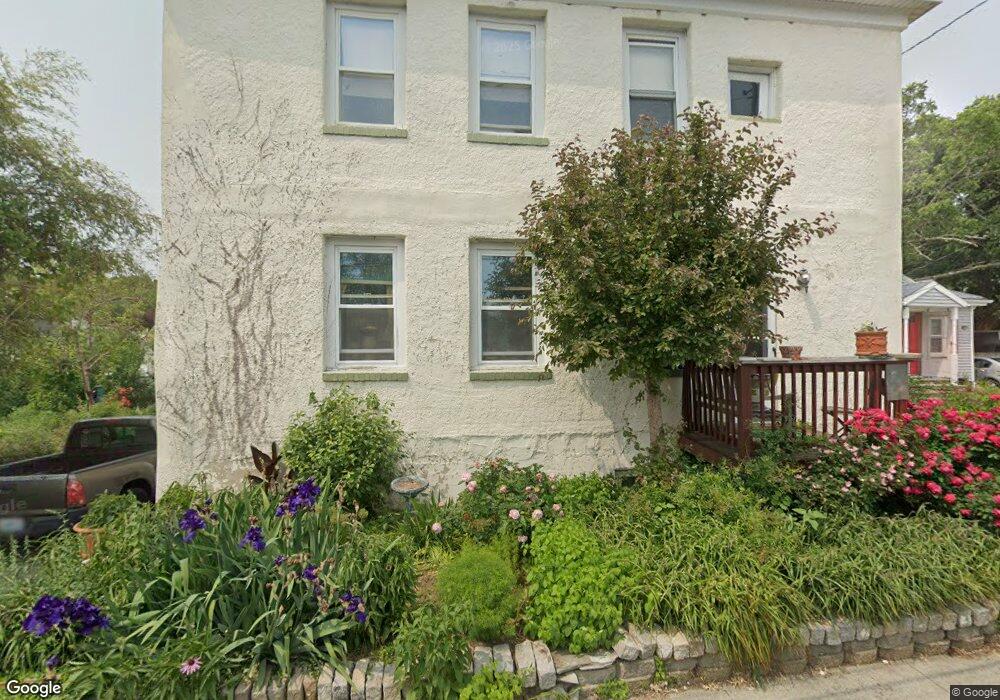
17 Ticknor St Providence, RI 02909
Manton NeighborhoodEstimated Value: $442,709 - $512,000
4
Beds
2
Baths
1,848
Sq Ft
$263/Sq Ft
Est. Value
About This Home
This home is located at 17 Ticknor St, Providence, RI 02909 and is currently estimated at $485,177, approximately $262 per square foot. 17 Ticknor St is a home located in Providence County with nearby schools including Charles N. Fortes Elementary School, Asa Messer Elementary School, and Laurel Hill Annex School.
Ownership History
Date
Name
Owned For
Owner Type
Purchase Details
Closed on
Dec 23, 2019
Sold by
Providence Water Supply
Bought by
Homewood Acres Rigp
Current Estimated Value
Purchase Details
Closed on
Jan 30, 2009
Sold by
Wells Fargo Bank Na
Bought by
T & D Dev Llc
Purchase Details
Closed on
Jun 3, 2008
Sold by
Segura Ingrid and Segura Richard
Bought by
Wells Fargo Bank Na
Purchase Details
Closed on
Aug 1, 2005
Sold by
Waterman William E
Bought by
Segura Richard and Segura Ingrid
Home Financials for this Owner
Home Financials are based on the most recent Mortgage that was taken out on this home.
Original Mortgage
$208,000
Interest Rate
5.67%
Mortgage Type
Purchase Money Mortgage
Purchase Details
Closed on
Oct 17, 1994
Sold by
Orourke Michael P
Bought by
Waterman William Edwar and Waterman Kathleen
Create a Home Valuation Report for This Property
The Home Valuation Report is an in-depth analysis detailing your home's value as well as a comparison with similar homes in the area
Home Values in the Area
Average Home Value in this Area
Purchase History
| Date | Buyer | Sale Price | Title Company |
|---|---|---|---|
| Homewood Acres Rigp | $1,421 | None Available | |
| T & D Dev Llc | $45,000 | -- | |
| Wells Fargo Bank Na | $262,956 | -- | |
| Segura Richard | $260,000 | -- | |
| Waterman William Edwar | $67,500 | -- |
Source: Public Records
Mortgage History
| Date | Status | Borrower | Loan Amount |
|---|---|---|---|
| Previous Owner | Waterman William Edwar | $297,000 | |
| Previous Owner | Waterman William Edwar | $208,000 |
Source: Public Records
Tax History Compared to Growth
Tax History
| Year | Tax Paid | Tax Assessment Tax Assessment Total Assessment is a certain percentage of the fair market value that is determined by local assessors to be the total taxable value of land and additions on the property. | Land | Improvement |
|---|---|---|---|---|
| 2025 | $3,257 | $431,400 | $133,300 | $298,100 |
| 2024 | $5,230 | $285,000 | $77,100 | $207,900 |
| 2023 | $5,230 | $285,000 | $77,100 | $207,900 |
| 2022 | $5,073 | $285,000 | $77,100 | $207,900 |
| 2021 | $4,590 | $186,900 | $58,100 | $128,800 |
| 2020 | $4,590 | $186,900 | $58,100 | $128,800 |
| 2019 | $4,590 | $186,900 | $58,100 | $128,800 |
| 2018 | $3,883 | $121,500 | $37,300 | $84,200 |
| 2017 | $3,883 | $121,500 | $37,300 | $84,200 |
| 2016 | $3,883 | $121,500 | $37,300 | $84,200 |
| 2015 | $3,472 | $104,900 | $34,200 | $70,700 |
| 2014 | $3,540 | $104,900 | $34,200 | $70,700 |
| 2013 | $3,540 | $104,900 | $34,200 | $70,700 |
Source: Public Records
Map
Nearby Homes
- 107 Sisson St
- 20 Brush Hill Rd
- 839 Manton Ave
- 20 Ridgeway Ave
- 100 Hillcrest Ave
- 66 Fairview St
- 61 Leah St
- 659 Manton Ave
- 588 Manton Ave
- 673 Manton Ave
- 5 Lynch St
- 685 Manton Ave
- 1397 Chalkstone Ave
- 149 Pomona Ave
- 16 Marconi St
- 0 Baltimore St
- 57 Fairmount Ave
- 353 Manton Ave
- 355 Manton Ave
- 53 Fairmount Ave