17 Twin Rivers Dr N East Windsor, NJ 08520
Estimated Value: $365,704 - $391,000
--
Bed
--
Bath
1,308
Sq Ft
$290/Sq Ft
Est. Value
About This Home
This home is located at 17 Twin Rivers Dr N, East Windsor, NJ 08520 and is currently estimated at $379,426, approximately $290 per square foot. 17 Twin Rivers Dr N is a home located in Mercer County with nearby schools including Oak Tree Elementary School, Monroe Township Middle School, and Monroe Township High School.
Ownership History
Date
Name
Owned For
Owner Type
Purchase Details
Closed on
Dec 15, 2004
Sold by
Avallone Nancy
Bought by
Avallone Richard
Current Estimated Value
Home Financials for this Owner
Home Financials are based on the most recent Mortgage that was taken out on this home.
Original Mortgage
$128,000
Outstanding Balance
$63,846
Interest Rate
5.67%
Estimated Equity
$315,580
Purchase Details
Closed on
Mar 27, 2000
Sold by
Reames J Michael
Bought by
Avallone Nancy
Purchase Details
Closed on
Aug 21, 1998
Sold by
Hutchings James
Bought by
Corley Margaret
Home Financials for this Owner
Home Financials are based on the most recent Mortgage that was taken out on this home.
Original Mortgage
$72,900
Interest Rate
6.8%
Purchase Details
Closed on
Jun 29, 1992
Sold by
Owens Clay and Owens Laurie
Bought by
Hutchings James and Hutchings Nancy
Purchase Details
Closed on
Oct 31, 1990
Sold by
Owens Gale Lorraine
Bought by
Owens Clay
Create a Home Valuation Report for This Property
The Home Valuation Report is an in-depth analysis detailing your home's value as well as a comparison with similar homes in the area
Home Values in the Area
Average Home Value in this Area
Purchase History
| Date | Buyer | Sale Price | Title Company |
|---|---|---|---|
| Avallone Richard | $160,000 | -- | |
| Avallone Nancy | $90,000 | -- | |
| Corley Margaret | $76,750 | -- | |
| Hutchings James | $86,400 | -- | |
| Owens Clay | -- | -- |
Source: Public Records
Mortgage History
| Date | Status | Borrower | Loan Amount |
|---|---|---|---|
| Open | Avallone Richard | $128,000 | |
| Previous Owner | Corley Margaret | $72,900 |
Source: Public Records
Tax History Compared to Growth
Tax History
| Year | Tax Paid | Tax Assessment Tax Assessment Total Assessment is a certain percentage of the fair market value that is determined by local assessors to be the total taxable value of land and additions on the property. | Land | Improvement |
|---|---|---|---|---|
| 2025 | $6,678 | $185,700 | $91,700 | $94,000 |
| 2024 | $6,310 | $185,700 | $91,700 | $94,000 |
| 2023 | $6,310 | $185,700 | $91,700 | $94,000 |
| 2022 | $6,141 | $185,700 | $91,700 | $94,000 |
| 2021 | $6,095 | $185,700 | $91,700 | $94,000 |
| 2020 | $6,102 | $185,700 | $91,700 | $94,000 |
| 2019 | $6,045 | $185,700 | $91,700 | $94,000 |
| 2018 | $6,193 | $185,700 | $91,700 | $94,000 |
| 2017 | $6,188 | $185,700 | $91,700 | $94,000 |
| 2016 | $5,870 | $185,700 | $91,700 | $94,000 |
| 2015 | $5,753 | $185,700 | $91,700 | $94,000 |
| 2014 | $5,682 | $185,700 | $91,700 | $94,000 |
Source: Public Records
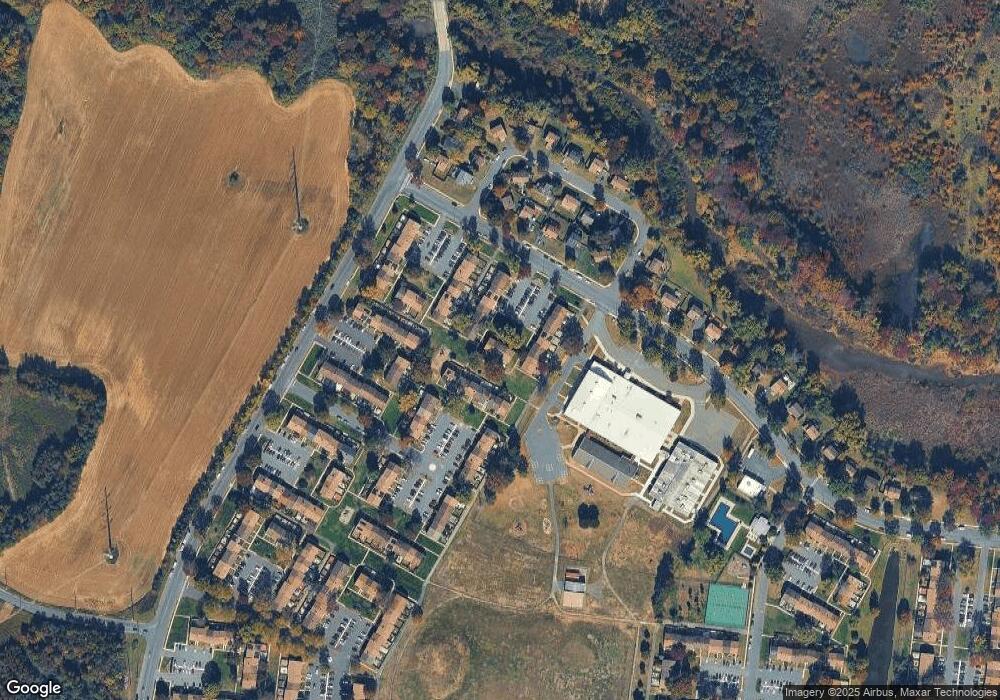
Map
Nearby Homes
- 7 Twin Rivers Dr N
- 2 Enfield Dr
- 49 Twin Rivers Dr N
- 127 Probasco Rd
- 322 Twin Rivers Dr N
- 476 Fairfield Rd
- 197 Canterbury Ct
- 542 Fairfield Rd
- 203 Canterbury Ct
- 234 Probasco Rd
- 406 Bolton Rd
- 942 Jamestown Rd
- D16 Avon Dr
- 842 Jamestown Rd
- C9 Avon Dr E
- 857 Jamestown Rd
- 10 Avon Dr
- 4 Avon Dr
- 4 Avon Dr Unit F
- 13 Avon Dr Unit P
- 15 Twin Rivers Dr N Unit L
- 15 Twin Rivers Dr N
- 19 Twin Rivers Dr N
- 20 Twin Rivers Dr N
- 13 Twin Rivers Dr N
- 13 Twin Rivers Dr N Unit L
- 13 Twin Rivers Dr N Unit M
- 21 Twin Rivers Dr N
- 12 Twin Rivers Dr N Unit M
- 12 Twin Rivers Dr N
- 12 Twin Rivers Dr N Unit L
- 14 Twin Rivers Dr N
- 22 Twin Rivers Dr N
- 87 Danbury Ct
- 88 Danbury Ct
- 89 Danbury Ct
- 23 Twin Rivers Dr N
- 85 Danbury Ct
- 11 Twin Rivers Dr N Unit M
- 11 Twin Rivers Dr N