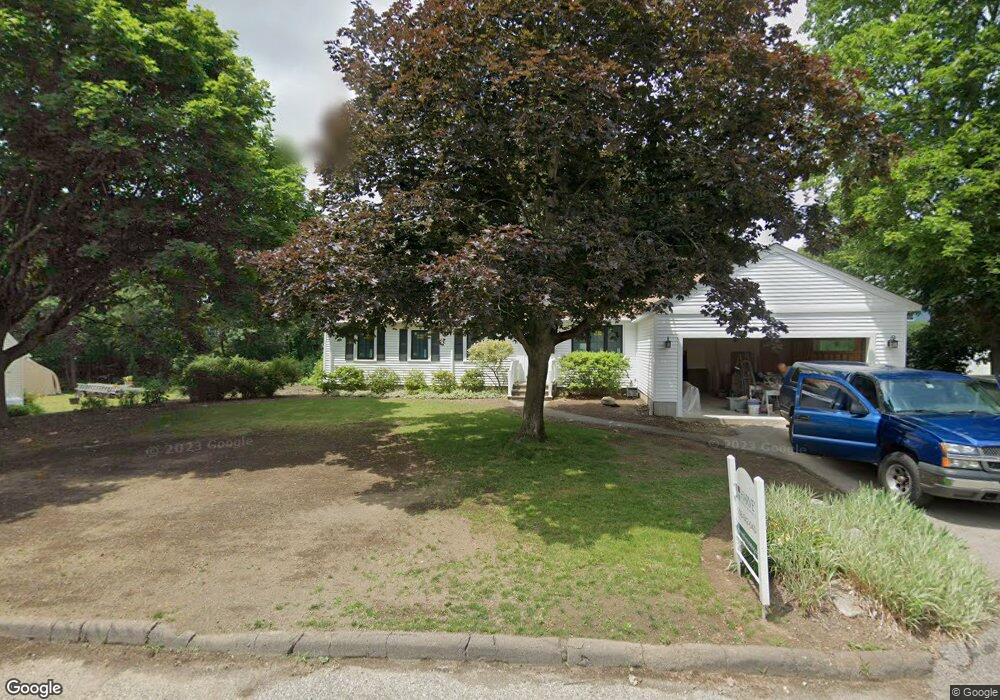
17 Tyler Ct Unit D Natick, MA 01760
Estimated Value: $803,100 - $891,000
3
Beds
1
Bath
1,377
Sq Ft
$619/Sq Ft
Est. Value
About This Home
This home is located at 17 Tyler Ct Unit D, Natick, MA 01760 and is currently estimated at $852,525, approximately $619 per square foot. 17 Tyler Ct Unit D is a home located in Middlesex County with nearby schools including Natick High School, Wilson Middle School, and Bennett-Hemenway (Ben-Hem) Elementary School.
Ownership History
Date
Name
Owned For
Owner Type
Purchase Details
Closed on
Apr 29, 2016
Sold by
Murphy Thomas F and Murphy Karen E
Bought by
Olsen Thomas R and Olsen Jill M
Current Estimated Value
Home Financials for this Owner
Home Financials are based on the most recent Mortgage that was taken out on this home.
Original Mortgage
$290,000
Outstanding Balance
$231,385
Interest Rate
3.73%
Mortgage Type
New Conventional
Estimated Equity
$621,140
Purchase Details
Closed on
Aug 15, 2011
Sold by
Lambert Anne M Est
Bought by
Murpy Thomas F and Murpy Karen E
Create a Home Valuation Report for This Property
The Home Valuation Report is an in-depth analysis detailing your home's value as well as a comparison with similar homes in the area
Home Values in the Area
Average Home Value in this Area
Purchase History
| Date | Buyer | Sale Price | Title Company |
|---|---|---|---|
| Olsen Thomas R | $490,000 | -- | |
| Murpy Thomas F | $335,700 | -- |
Source: Public Records
Mortgage History
| Date | Status | Borrower | Loan Amount |
|---|---|---|---|
| Open | Olsen Thomas R | $290,000 |
Source: Public Records
Tax History Compared to Growth
Tax History
| Year | Tax Paid | Tax Assessment Tax Assessment Total Assessment is a certain percentage of the fair market value that is determined by local assessors to be the total taxable value of land and additions on the property. | Land | Improvement |
|---|---|---|---|---|
| 2025 | $7,640 | $638,800 | $459,500 | $179,300 |
| 2024 | $7,410 | $604,400 | $432,400 | $172,000 |
| 2023 | $7,379 | $583,800 | $413,000 | $170,800 |
| 2022 | $7,138 | $535,100 | $372,700 | $162,400 |
| 2021 | $6,843 | $502,800 | $351,400 | $151,400 |
| 2020 | $6,625 | $486,800 | $335,400 | $151,400 |
| 2019 | $6,187 | $486,800 | $335,400 | $151,400 |
| 2018 | $5,816 | $445,700 | $319,400 | $126,300 |
| 2017 | $5,441 | $403,300 | $279,300 | $124,000 |
| 2016 | $5,172 | $381,100 | $258,300 | $122,800 |
| 2015 | $5,090 | $368,300 | $258,300 | $110,000 |
Source: Public Records
Map
Nearby Homes
- 7 Jackson Ct Unit B
- 287 Bacon St
- 293 Bacon St Unit A
- 12 Linden St
- 8 Flynn St
- 58 N Main St Unit 304
- 8 Stanley St
- 8 Hartford St
- 34 N Main St Unit 2
- 13 Sheffield Rd
- 2 Yuba Place
- 4 Willow St
- 278 N Main St
- 7 Sheffield Rd
- 26 Walnut St
- 39 Evergreen Rd
- 20 Florence St Unit B
- 18 Magnolia Rd
- 49 Summer St
- 4 Richard Rd