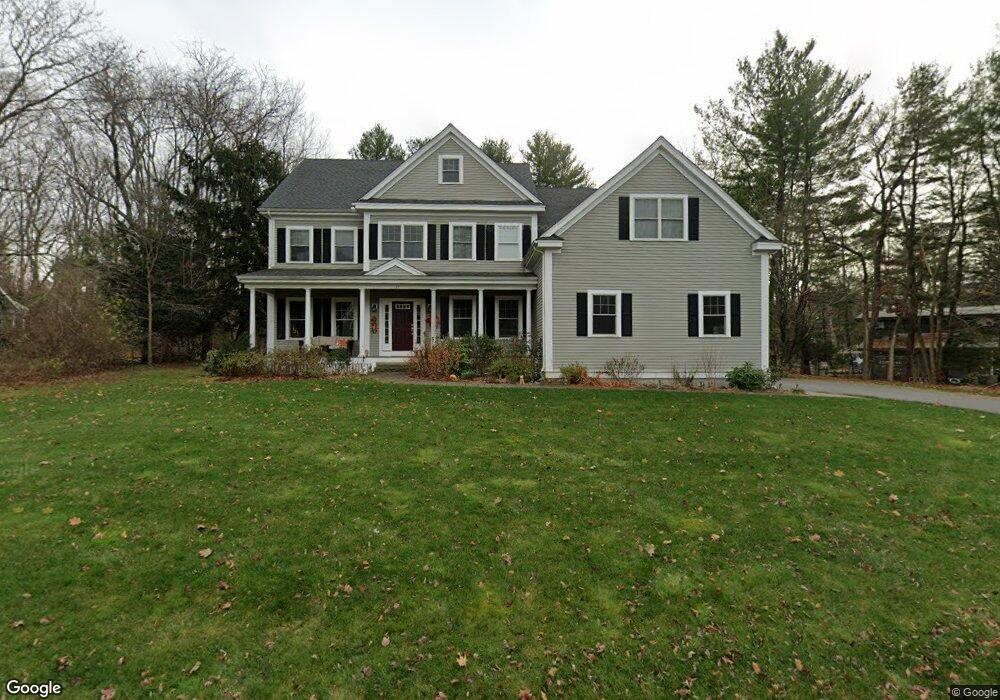
17 Tyler Rd Lexington, MA 02420
Countryside NeighborhoodEstimated Value: $1,314,000 - $3,742,000
5
Beds
2
Baths
1,567
Sq Ft
$1,775/Sq Ft
Est. Value
About This Home
This home is located at 17 Tyler Rd, Lexington, MA 02420 and is currently estimated at $2,781,777, approximately $1,775 per square foot. 17 Tyler Rd is a home located in Middlesex County with nearby schools including Harrington Elementary School, Jonas Clarke Middle School, and Lexington High School.
Ownership History
Date
Name
Owned For
Owner Type
Purchase Details
Closed on
Jun 26, 2017
Sold by
Seaver Properties Llc
Bought by
Mitragotri Samir S and Mitragotri Deepali S
Current Estimated Value
Home Financials for this Owner
Home Financials are based on the most recent Mortgage that was taken out on this home.
Original Mortgage
$911,200
Outstanding Balance
$760,361
Interest Rate
4.05%
Mortgage Type
Unknown
Estimated Equity
$2,021,416
Purchase Details
Closed on
Dec 6, 2016
Sold by
Kiliulis Ceslovas Est
Bought by
Seaver Properties Llc
Home Financials for this Owner
Home Financials are based on the most recent Mortgage that was taken out on this home.
Original Mortgage
$1,252,000
Interest Rate
3.52%
Mortgage Type
Unknown
Purchase Details
Closed on
Mar 1, 1965
Bought by
Kiliulis Ceslovas and Kiliulis Laima
Create a Home Valuation Report for This Property
The Home Valuation Report is an in-depth analysis detailing your home's value as well as a comparison with similar homes in the area
Home Values in the Area
Average Home Value in this Area
Purchase History
| Date | Buyer | Sale Price | Title Company |
|---|---|---|---|
| Mitragotri Samir S | $2,139,000 | -- | |
| Seaver Properties Llc | $790,000 | -- | |
| Kiliulis Ceslovas | $68,500 | -- |
Source: Public Records
Mortgage History
| Date | Status | Borrower | Loan Amount |
|---|---|---|---|
| Open | Mitragotri Samir S | $911,200 | |
| Previous Owner | Seaver Properties Llc | $1,252,000 |
Source: Public Records
Tax History Compared to Growth
Tax History
| Year | Tax Paid | Tax Assessment Tax Assessment Total Assessment is a certain percentage of the fair market value that is determined by local assessors to be the total taxable value of land and additions on the property. | Land | Improvement |
|---|---|---|---|---|
| 2025 | $33,694 | $2,755,000 | $960,000 | $1,795,000 |
| 2024 | $32,659 | $2,666,000 | $914,000 | $1,752,000 |
| 2023 | $30,615 | $2,355,000 | $831,000 | $1,524,000 |
| 2022 | $29,794 | $2,159,000 | $756,000 | $1,403,000 |
| 2021 | $30,823 | $2,142,000 | $750,000 | $1,392,000 |
| 2020 | $28,606 | $2,036,000 | $750,000 | $1,286,000 |
| 2019 | $27,972 | $1,981,000 | $714,000 | $1,267,000 |
| 2018 | $26,398 | $1,846,000 | $680,000 | $1,166,000 |
| 2017 | $10,056 | $694,000 | $518,000 | $176,000 |
| 2016 | $9,680 | $663,000 | $493,000 | $170,000 |
| 2015 | $9,302 | $626,000 | $448,000 | $178,000 |
| 2014 | $8,965 | $578,000 | $407,000 | $171,000 |
Source: Public Records
Map
Nearby Homes