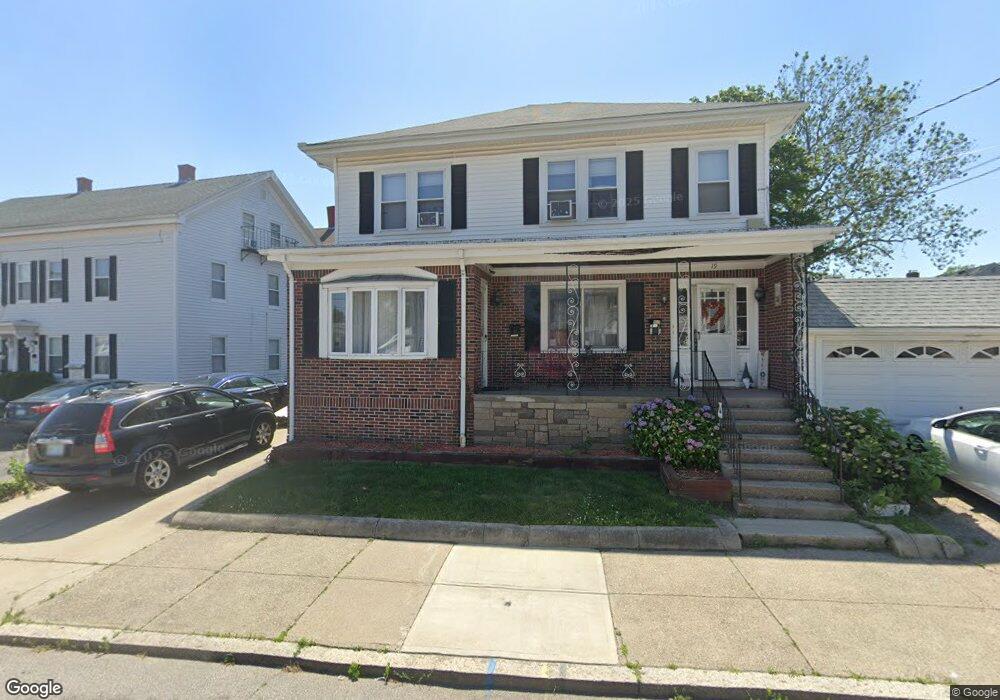
17 Tyler St Pawtucket, RI 02860
Quality Hill NeighborhoodEstimated Value: $478,922 - $555,000
4
Beds
2
Baths
1,944
Sq Ft
$261/Sq Ft
Est. Value
About This Home
This home is located at 17 Tyler St, Pawtucket, RI 02860 and is currently estimated at $507,231, approximately $260 per square foot. 17 Tyler St is a home located in Providence County with nearby schools including International Charter School, Blackstone Academy Charter School, and Saint Raphael Academy.
Ownership History
Date
Name
Owned For
Owner Type
Purchase Details
Closed on
Oct 18, 1988
Sold by
Grasso John
Bought by
Rybka Peter
Current Estimated Value
Home Financials for this Owner
Home Financials are based on the most recent Mortgage that was taken out on this home.
Original Mortgage
$128,250
Interest Rate
10.63%
Create a Home Valuation Report for This Property
The Home Valuation Report is an in-depth analysis detailing your home's value as well as a comparison with similar homes in the area
Home Values in the Area
Average Home Value in this Area
Purchase History
| Date | Buyer | Sale Price | Title Company |
|---|---|---|---|
| Rybka Peter | $135,000 | -- |
Source: Public Records
Mortgage History
| Date | Status | Borrower | Loan Amount |
|---|---|---|---|
| Open | Rybka Peter | $29,000 | |
| Closed | Rybka Peter | $10,000 | |
| Open | Rybka Peter | $87,000 | |
| Closed | Rybka Peter | $128,250 |
Source: Public Records
Tax History
| Year | Tax Paid | Tax Assessment Tax Assessment Total Assessment is a certain percentage of the fair market value that is determined by local assessors to be the total taxable value of land and additions on the property. | Land | Improvement |
|---|---|---|---|---|
| 2025 | $5,010 | $381,000 | $99,600 | $281,400 |
| 2024 | $4,702 | $381,000 | $99,600 | $281,400 |
| 2023 | $4,352 | $256,900 | $57,700 | $199,200 |
| 2022 | $4,259 | $256,900 | $57,700 | $199,200 |
| 2021 | $4,259 | $256,900 | $57,700 | $199,200 |
| 2020 | $3,769 | $180,400 | $48,100 | $132,300 |
| 2019 | $3,769 | $180,400 | $48,100 | $132,300 |
| 2018 | $3,631 | $180,400 | $48,100 | $132,300 |
| 2017 | $3,288 | $144,700 | $38,600 | $106,100 |
| 2016 | $3,167 | $144,700 | $38,600 | $106,100 |
| 2015 | $3,167 | $144,700 | $38,600 | $106,100 |
| 2014 | $3,125 | $135,500 | $38,600 | $96,900 |
Source: Public Records
Map
Nearby Homes
- 70 Brewster St
- 100 Pond St
- 36 Underwood St
- 146 S Bend St
- 23 Spring St
- 89 Armistice Blvd
- 10 Exchange Ct Unit 203
- 133 Cottage St
- 19 Wood St
- 48 Kossuth St
- 150 N Bend St
- 44 Pawtucket Ave
- 333 School St Unit 109
- 11 Crane St
- 345 Pleasant St
- 349 Pleasant St
- 28 Bayley St Unit 107
- 153 Central Ave
- 33 Dover St
- 256 High St
Your Personal Tour Guide
Ask me questions while you tour the home.