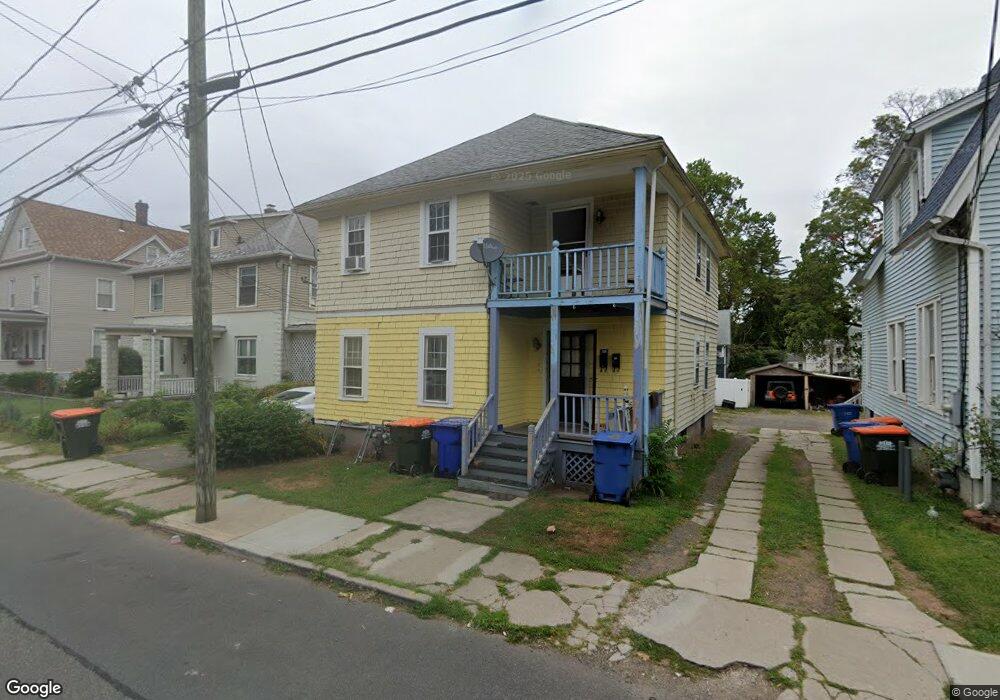
17 Union St Meriden, CT 06451
Estimated Value: $160,305 - $328,000
4
Beds
2
Baths
1,596
Sq Ft
$174/Sq Ft
Est. Value
About This Home
This home is located at 17 Union St, Meriden, CT 06451 and is currently estimated at $277,326, approximately $173 per square foot. 17 Union St is a home located in New Haven County with nearby schools including John Barry School, Lincoln Middle School, and Orville H. Platt High School.
Ownership History
Date
Name
Owned For
Owner Type
Purchase Details
Closed on
Aug 19, 2011
Sold by
Bank Of New York Mello
Bought by
Dornfried Lisa
Current Estimated Value
Purchase Details
Closed on
Jul 26, 2011
Sold by
Amoah Mavis A
Bought by
Bank Of New York
Purchase Details
Closed on
May 25, 2005
Sold by
Mendoza Robert
Bought by
Amoah Marvis A
Home Financials for this Owner
Home Financials are based on the most recent Mortgage that was taken out on this home.
Original Mortgage
$119,200
Interest Rate
7.5%
Purchase Details
Closed on
Sep 3, 1987
Sold by
Est Marion W Sheedy
Bought by
Mendoza Robert
Create a Home Valuation Report for This Property
The Home Valuation Report is an in-depth analysis detailing your home's value as well as a comparison with similar homes in the area
Home Values in the Area
Average Home Value in this Area
Purchase History
| Date | Buyer | Sale Price | Title Company |
|---|---|---|---|
| Dornfried Lisa | $48,000 | -- | |
| Bank Of New York | -- | -- | |
| Amoah Marvis A | $149,000 | -- | |
| Mendoza Robert | $97,000 | -- |
Source: Public Records
Mortgage History
| Date | Status | Borrower | Loan Amount |
|---|---|---|---|
| Previous Owner | Mendoza Robert | $174,600 | |
| Previous Owner | Mendoza Robert | $119,200 | |
| Previous Owner | Mendoza Robert | $29,800 |
Source: Public Records
Tax History Compared to Growth
Tax History
| Year | Tax Paid | Tax Assessment Tax Assessment Total Assessment is a certain percentage of the fair market value that is determined by local assessors to be the total taxable value of land and additions on the property. | Land | Improvement |
|---|---|---|---|---|
| 2025 | $3,750 | $98,910 | $18,480 | $80,430 |
| 2024 | $3,809 | $98,910 | $18,480 | $80,430 |
| 2023 | $3,672 | $98,910 | $18,480 | $80,430 |
| 2022 | $3,464 | $98,910 | $18,480 | $80,430 |
| 2021 | $3,001 | $68,950 | $15,610 | $53,340 |
| 2020 | $2,993 | $68,950 | $15,610 | $53,340 |
| 2019 | $2,968 | $68,950 | $15,610 | $53,340 |
| 2018 | $2,979 | $68,950 | $15,610 | $53,340 |
| 2017 | $2,900 | $68,950 | $15,610 | $53,340 |
| 2016 | $2,996 | $77,490 | $17,500 | $59,990 |
| 2015 | $2,996 | $77,280 | $17,290 | $59,990 |
| 2014 | $2,924 | $77,280 | $17,290 | $59,990 |
Source: Public Records
Map
Nearby Homes