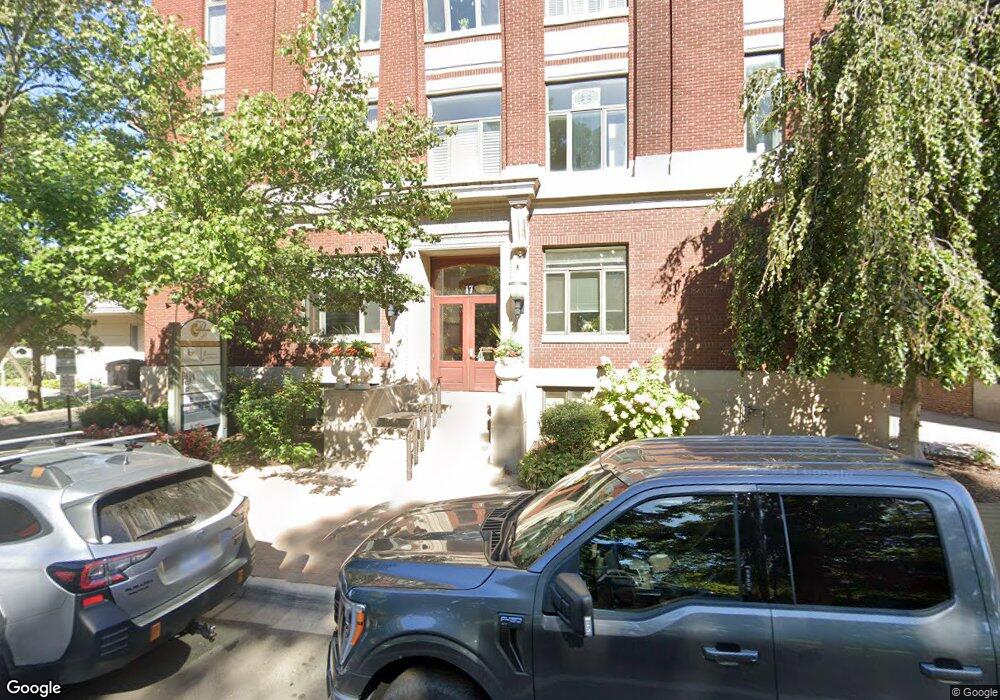
17 W 10th St Unit 280 Holland, MI 49423
Downtown Holland NeighborhoodEstimated Value: $219,000 - $257,626
1
Bed
1
Bath
550
Sq Ft
$440/Sq Ft
Est. Value
About This Home
This home is located at 17 W 10th St Unit 280, Holland, MI 49423 and is currently estimated at $242,157, approximately $440 per square foot. 17 W 10th St Unit 280 is a home located in Ottawa County with nearby schools including Maplewood, Holland High School, and Holland Middle School.
Ownership History
Date
Name
Owned For
Owner Type
Purchase Details
Closed on
Jul 20, 2022
Sold by
Marie Oconnor Suzanne
Bought by
Oconnor Suzanne Marie
Current Estimated Value
Purchase Details
Closed on
Sep 29, 2017
Sold by
Bordelon Susan E
Bought by
Connor Suzanne Marie O
Home Financials for this Owner
Home Financials are based on the most recent Mortgage that was taken out on this home.
Original Mortgage
$97,750
Interest Rate
3.83%
Mortgage Type
New Conventional
Purchase Details
Closed on
Jul 13, 2015
Sold by
Bordelon Susan E and Gebben Vernon D
Bought by
Bordelon Susan E and Dancing Dog Farm Trust
Purchase Details
Closed on
May 7, 2004
Sold by
Rework Designs Inc
Bought by
Flanagan Susan and Gebben Vernon D
Home Financials for this Owner
Home Financials are based on the most recent Mortgage that was taken out on this home.
Original Mortgage
$84,000
Interest Rate
4.99%
Mortgage Type
Purchase Money Mortgage
Purchase Details
Closed on
Oct 10, 2001
Sold by
Centennial Partners
Bought by
Rework Designs Inc
Create a Home Valuation Report for This Property
The Home Valuation Report is an in-depth analysis detailing your home's value as well as a comparison with similar homes in the area
Home Values in the Area
Average Home Value in this Area
Purchase History
| Date | Buyer | Sale Price | Title Company |
|---|---|---|---|
| Oconnor Suzanne Marie | -- | None Listed On Document | |
| Connor Suzanne Marie O | $115,000 | Chicago Title | |
| Bordelon Susan E | -- | None Available | |
| Flanagan Susan | $105,000 | Metropolitan Title Company | |
| Rework Designs Inc | $98,900 | -- |
Source: Public Records
Mortgage History
| Date | Status | Borrower | Loan Amount |
|---|---|---|---|
| Previous Owner | Connor Suzanne Marie O | $97,750 | |
| Previous Owner | Flanagan Susan | $84,000 |
Source: Public Records
Tax History Compared to Growth
Tax History
| Year | Tax Paid | Tax Assessment Tax Assessment Total Assessment is a certain percentage of the fair market value that is determined by local assessors to be the total taxable value of land and additions on the property. | Land | Improvement |
|---|---|---|---|---|
| 2025 | $2,404 | $104,200 | $0 | $0 |
| 2024 | $2,396 | $94,200 | $0 | $0 |
| 2023 | $2,241 | $61,700 | $0 | $0 |
| 2022 | $2,137 | $52,700 | $0 | $0 |
| 2021 | $2,078 | $51,300 | $0 | $0 |
| 2020 | $2,066 | $47,100 | $0 | $0 |
| 2019 | $2,157 | $47,900 | $0 | $0 |
| 2018 | $2,138 | $47,400 | $0 | $0 |
| 2017 | $2,189 | $47,400 | $0 | $0 |
| 2016 | $2,189 | $40,600 | $0 | $0 |
| 2015 | $2,224 | $35,500 | $0 | $0 |
| 2014 | $2,224 | $40,700 | $0 | $0 |
Source: Public Records
Map
Nearby Homes
- 17 W 10th St Unit 420
- 50 W 8th St Unit 403
- 159 S River Ave Unit 403
- 159 S River Ave Unit 504
- 159 S River Ave Unit 305
- 159 S River Ave Unit 503
- 159 S River Ave Unit 303
- 159 S River Ave Unit 502
- 159 S River Ave Unit 406
- 159 S River Ave Unit 404
- 29 E 16th St
- 186 W 12th St
- 162 W 14th St
- 13 W 17th St
- 220 W 11th St
- 94 W 17th St
- 198 W 14th St
- 150 W 16th St
- 215 W 14th St
- 243 W 14th St
- 17 W 10th St Unit 50
- 17 W 10th St Unit 60
- 17 W 10th St Unit 270
- 17 W 10th St Unit 260
- 17 W 10th St Unit 370
- 17 W 10th St Unit 460
- 17 W 10th St Unit 210
- 17 W 10th St Unit 440
- 17 W 10th St Unit 290
- 17 W 10th St Unit 40
- 17 W 10th St Unit 70
- 17 W 10th St Unit 450
- 17 W 10th St Unit 350
- 17 W 10th St Unit 480
- 17 W 10th St Unit 470
- 17 W 10th St Unit 430
- 17 W 10th St Unit 320
- 17 W 10th St Unit 340
- 17 W 10th St Unit 360
- 17 W 10th St Unit 380