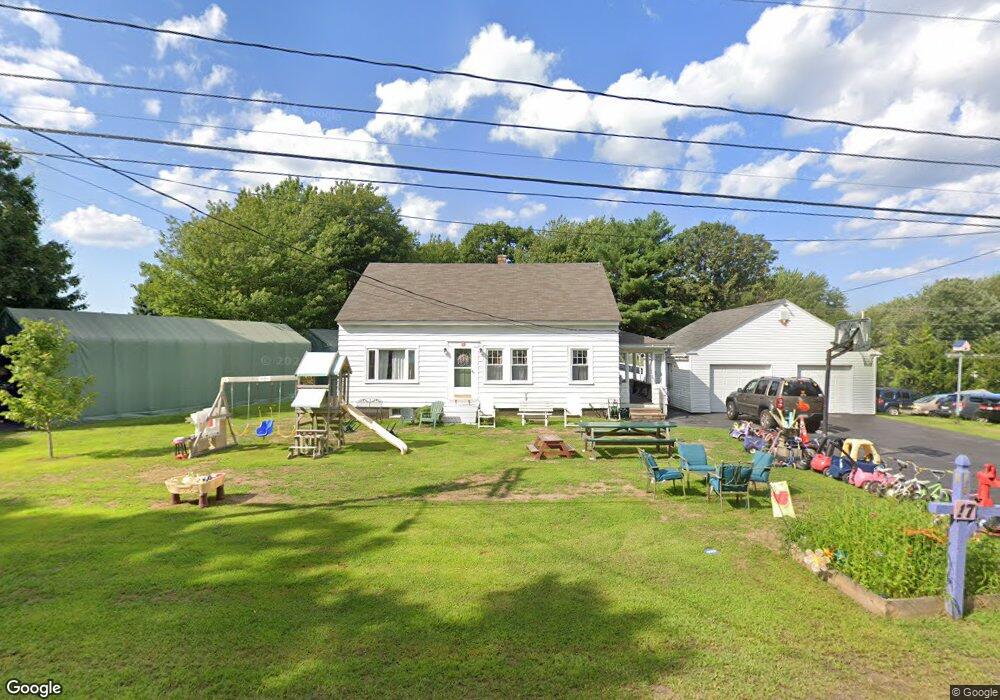
17 W Loop Rd Biddeford, ME 04005
South Biddeford NeighborhoodEstimated Value: $406,645 - $476,000
4
Beds
1
Bath
1,478
Sq Ft
$297/Sq Ft
Est. Value
About This Home
This home is located at 17 W Loop Rd, Biddeford, ME 04005 and is currently estimated at $438,661, approximately $296 per square foot. 17 W Loop Rd is a home located in York County with nearby schools including John F Kennedy Memorial School, Biddeford Primary School, and Biddeford Intermediate School.
Ownership History
Date
Name
Owned For
Owner Type
Purchase Details
Closed on
May 24, 2019
Sold by
Chandler Kevin
Bought by
Chandler Kevin P and Kent Nicole A
Current Estimated Value
Home Financials for this Owner
Home Financials are based on the most recent Mortgage that was taken out on this home.
Original Mortgage
$192,867
Outstanding Balance
$169,638
Interest Rate
4.62%
Mortgage Type
FHA
Estimated Equity
$269,023
Create a Home Valuation Report for This Property
The Home Valuation Report is an in-depth analysis detailing your home's value as well as a comparison with similar homes in the area
Home Values in the Area
Average Home Value in this Area
Purchase History
| Date | Buyer | Sale Price | Title Company |
|---|---|---|---|
| Chandler Kevin P | -- | -- | |
| Chandler Kevin P | -- | -- | |
| Chandler Kevin P | -- | -- |
Source: Public Records
Mortgage History
| Date | Status | Borrower | Loan Amount |
|---|---|---|---|
| Open | Chandler Kevin P | $192,867 | |
| Closed | Chandler Kevin P | $192,867 |
Source: Public Records
Tax History
| Year | Tax Paid | Tax Assessment Tax Assessment Total Assessment is a certain percentage of the fair market value that is determined by local assessors to be the total taxable value of land and additions on the property. | Land | Improvement |
|---|---|---|---|---|
| 2025 | $4,708 | $315,100 | $173,700 | $141,400 |
| 2024 | $4,442 | $312,400 | $173,700 | $138,700 |
| 2023 | $4,055 | $309,100 | $170,400 | $138,700 |
| 2022 | $3,714 | $226,300 | $96,000 | $130,300 |
| 2021 | $3,024 | $190,900 | $81,100 | $109,800 |
| 2020 | $608 | $174,500 | $73,800 | $100,700 |
| 2019 | $8,368 | $174,500 | $73,800 | $100,700 |
| 2018 | $3,267 | $174,500 | $73,800 | $100,700 |
| 2017 | $589 | $171,100 | $73,800 | $97,300 |
| 2016 | $1,772 | $171,100 | $73,800 | $97,300 |
| 2015 | $3,137 | $171,100 | $73,800 | $97,300 |
| 2014 | $3,059 | $171,100 | $73,800 | $97,300 |
| 2013 | -- | $171,800 | $65,100 | $106,700 |
Source: Public Records
Map
Nearby Homes
Your Personal Tour Guide
Ask me questions while you tour the home.