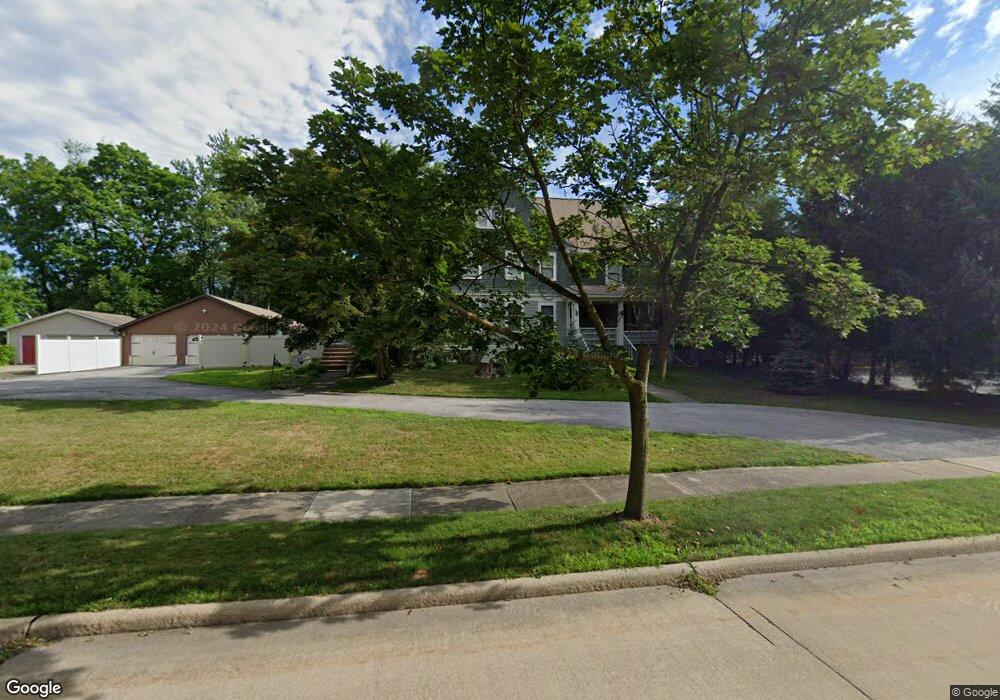
17 Wandle Ave Bedford, OH 44146
Estimated Value: $185,000 - $308,000
5
Beds
4
Baths
3,290
Sq Ft
$79/Sq Ft
Est. Value
About This Home
This home is located at 17 Wandle Ave, Bedford, OH 44146 and is currently estimated at $260,541, approximately $79 per square foot. 17 Wandle Ave is a home located in Cuyahoga County with nearby schools including Heskett Middle School, Bedford High School, and Ohio College Preparatory School.
Ownership History
Date
Name
Owned For
Owner Type
Purchase Details
Closed on
Sep 29, 2003
Sold by
Jablonski Paul M
Bought by
Waugh Ralph E
Current Estimated Value
Home Financials for this Owner
Home Financials are based on the most recent Mortgage that was taken out on this home.
Original Mortgage
$176,234
Outstanding Balance
$83,312
Interest Rate
6.4%
Mortgage Type
FHA
Estimated Equity
$177,230
Purchase Details
Closed on
Apr 14, 1977
Sold by
Yarish Richard F and L M
Bought by
Barton Theodore M
Purchase Details
Closed on
Jan 1, 1975
Bought by
Yarish Richard F and L M
Create a Home Valuation Report for This Property
The Home Valuation Report is an in-depth analysis detailing your home's value as well as a comparison with similar homes in the area
Home Values in the Area
Average Home Value in this Area
Purchase History
| Date | Buyer | Sale Price | Title Company |
|---|---|---|---|
| Waugh Ralph E | $179,000 | Real Estate Title | |
| Barton Theodore M | -- | -- | |
| Yarish Richard F | -- | -- |
Source: Public Records
Mortgage History
| Date | Status | Borrower | Loan Amount |
|---|---|---|---|
| Open | Waugh Ralph E | $176,234 |
Source: Public Records
Tax History Compared to Growth
Tax History
| Year | Tax Paid | Tax Assessment Tax Assessment Total Assessment is a certain percentage of the fair market value that is determined by local assessors to be the total taxable value of land and additions on the property. | Land | Improvement |
|---|---|---|---|---|
| 2024 | $6,113 | $81,760 | $11,270 | $70,490 |
| 2023 | $4,462 | $50,760 | $9,910 | $40,850 |
| 2022 | $3,936 | $50,750 | $9,910 | $40,850 |
| 2021 | $3,846 | $50,750 | $9,910 | $40,850 |
| 2020 | $3,851 | $45,710 | $8,930 | $36,790 |
| 2019 | $3,750 | $130,600 | $25,500 | $105,100 |
| 2018 | $3,734 | $45,710 | $8,930 | $36,790 |
| 2017 | $3,926 | $45,610 | $7,530 | $38,080 |
| 2016 | $3,892 | $45,610 | $7,530 | $38,080 |
| 2015 | $4,023 | $45,610 | $7,530 | $38,080 |
| 2014 | $4,023 | $49,560 | $8,190 | $41,370 |
Source: Public Records
Map
Nearby Homes