17 Wangum Rd Westbrook, CT 06498
Estimated Value: $563,000 - $1,290,000
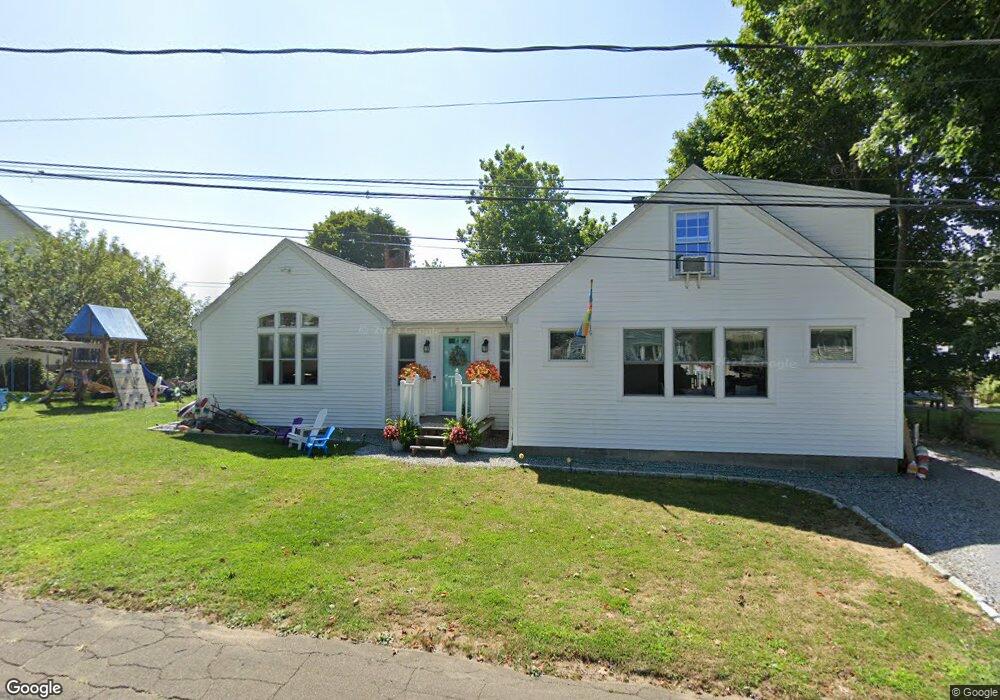
About This Home
This home is located at 17 Wangum Rd, Westbrook, CT 06498 and is currently estimated at $801,664, approximately $405 per square foot. 17 Wangum Rd is a home located in Middlesex County with nearby schools including Daisy Ingraham School, Westbrook Middle School, and Westbrook High School.
Ownership History
We collect this data history from publicly available records. To have your information removed, we recommend requesting removal directly through your county’s website.
Purchase Details
Home Financials for this Owner
Home Financials are based on the most recent Mortgage that was taken out on this home.Purchase Details
Home Financials for this Owner
Home Financials are based on the most recent Mortgage that was taken out on this home.Purchase Details
Purchase Details
Home Financials for this Owner
Home Financials are based on the most recent Mortgage that was taken out on this home.Home Values in the Area
Average Home Value in this Area
Purchase History
We collect this data history from publicly available records. To have your information removed, we recommend requesting removal directly through your county’s website.
| Date | Buyer | Sale Price | Title Company |
|---|---|---|---|
| -- | None Available | ||
| $360,000 | None Available | ||
| $400,000 | -- | ||
| $140,000 | -- |
Mortgage History
We collect this data history from publicly available records. To have your information removed, we recommend requesting removal directly through your county’s website.
| Date | Status | Borrower | Loan Amount |
|---|---|---|---|
| Open | $349,200 | ||
| Previous Owner | $187,600 | ||
| Previous Owner | $115,000 |
Tax History
We collect this data history from publicly available records. To have your information removed, we recommend requesting removal directly through your county’s website.
| Year | Tax Paid | Tax Assessment Tax Assessment Total Assessment is a certain percentage of the fair market value that is determined by local assessors to be the total taxable value of land and additions on the property. | Land | Improvement |
|---|---|---|---|---|
| 2025 | $7,138 | $317,240 | $165,400 | $151,840 |
| 2024 | $6,884 | $317,240 | $165,400 | $151,840 |
| 2023 | $6,764 | $317,240 | $165,400 | $151,840 |
| 2022 | $6,581 | $316,990 | $165,400 | $151,590 |
| 2021 | $6,323 | $252,930 | $119,280 | $133,650 |
| 2020 | $6,323 | $252,930 | $119,280 | $133,650 |
| 2019 | $6,240 | $252,930 | $119,280 | $133,650 |
| 2018 | $6,164 | $252,930 | $119,280 | $133,650 |
| 2017 | $6,164 | $252,930 | $119,280 | $133,650 |
| 2016 | $5,760 | $248,910 | $113,980 | $134,930 |
| 2015 | $5,603 | $248,910 | $113,980 | $134,930 |
| 2014 | $5,424 | $248,910 | $113,980 | $134,930 |
Map
- 47 Old Mail Trail
- 23 Linden Ave N
- 15 Broadway N
- 10 Chestnut Dr
- 44 Linden Ave N
- 68 Groveway
- 48 Groveway
- 6 Leeway Dr
- 0 Boston Post Rd Unit 24080344
- 15 Bluff Ave
- 40 Beach Rd
- 449 Seaside Ave
- 296 E Main St
- 0 Causeway
- 448 Grove Beach Rd N
- 448 A - B Grove Beach Rd N
- 438 Grove Beach Rd N
- 167 Shore Rd
- 144 Shore Rd
- 273 Seaside Ave
Ask me questions while you tour the home.