Estimated Value: $249,000 - $326,000
1
Bed
1
Bath
1,846
Sq Ft
$149/Sq Ft
Est. Value
About This Home
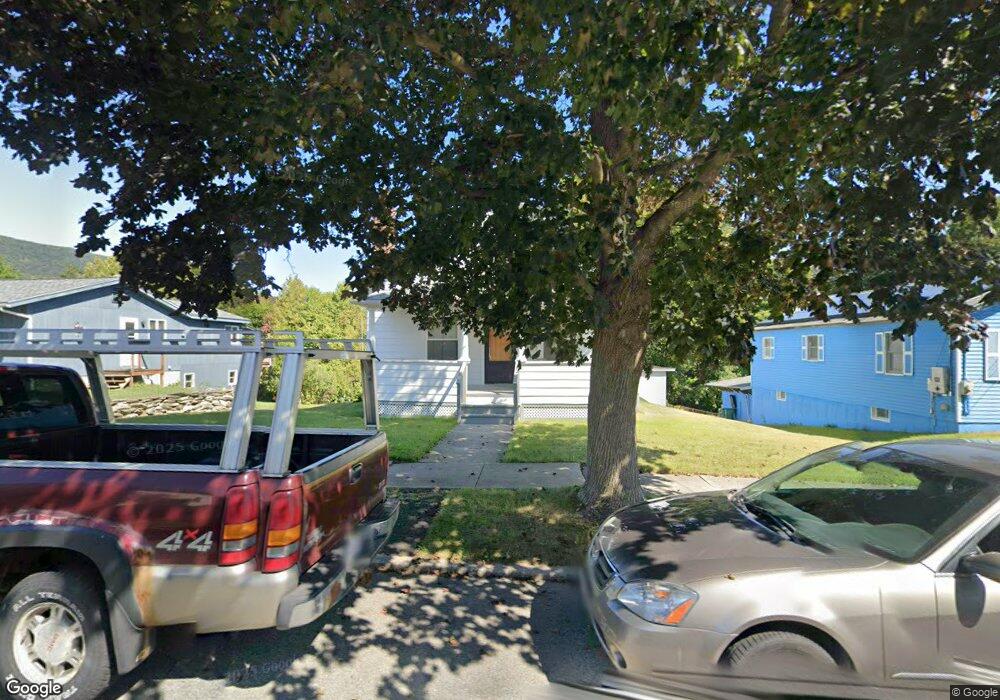
This home is located at 17 West St, Adams, MA 01220 and is currently estimated at $275,478, approximately $149 per square foot. 17 West St is a home located in Berkshire County with nearby schools including Hoosac Valley Middle & High School, Berkshire Arts & Technology Charter Public School, and St. Stanislaus Kostka School.
Ownership History
Date
Name
Owned For
Owner Type
Purchase Details
Closed on
Sep 10, 2010
Sold by
Coussoule Peter A and Coussoule Betty J
Bought by
Coussoule Peter A
Current Estimated Value
Purchase Details
Closed on
Aug 3, 1999
Sold by
Sanguinette Florence A and Coussoule Peter A
Bought by
Coussoule Peter A
Home Financials for this Owner
Home Financials are based on the most recent Mortgage that was taken out on this home.
Original Mortgage
$26,000
Interest Rate
7.61%
Mortgage Type
Purchase Money Mortgage
Create a Home Valuation Report for This Property
The Home Valuation Report is an in-depth analysis detailing your home's value as well as a comparison with similar homes in the area
Home Values in the Area
Average Home Value in this Area
Purchase History
| Date | Buyer | Sale Price | Title Company |
|---|---|---|---|
| Coussoule Peter A | -- | -- | |
| Coussoule Peter A | $85,000 | -- |
Source: Public Records
Mortgage History
| Date | Status | Borrower | Loan Amount |
|---|---|---|---|
| Previous Owner | Coussoule Peter A | $26,000 |
Source: Public Records
Tax History
| Year | Tax Paid | Tax Assessment Tax Assessment Total Assessment is a certain percentage of the fair market value that is determined by local assessors to be the total taxable value of land and additions on the property. | Land | Improvement |
|---|---|---|---|---|
| 2025 | $4,173 | $245,300 | $54,300 | $191,000 |
| 2024 | $3,932 | $224,200 | $51,100 | $173,100 |
| 2023 | $3,652 | $196,900 | $46,400 | $150,500 |
| 2022 | $3,553 | $170,100 | $40,400 | $129,700 |
| 2021 | $3,472 | $153,500 | $40,400 | $113,100 |
| 2020 | $3,280 | $149,900 | $40,600 | $109,300 |
| 2019 | $3,206 | $149,900 | $40,600 | $109,300 |
| 2018 | $3,285 | $147,900 | $40,600 | $107,300 |
| 2017 | $3,054 | $142,900 | $40,600 | $102,300 |
| 2016 | $2,965 | $138,600 | $40,600 | $98,000 |
| 2015 | $2,900 | $135,700 | $42,500 | $93,200 |
| 2014 | $2,707 | $135,700 | $42,500 | $93,200 |
Source: Public Records
Map
Nearby Homes
Your Personal Tour Guide
Ask me questions while you tour the home.