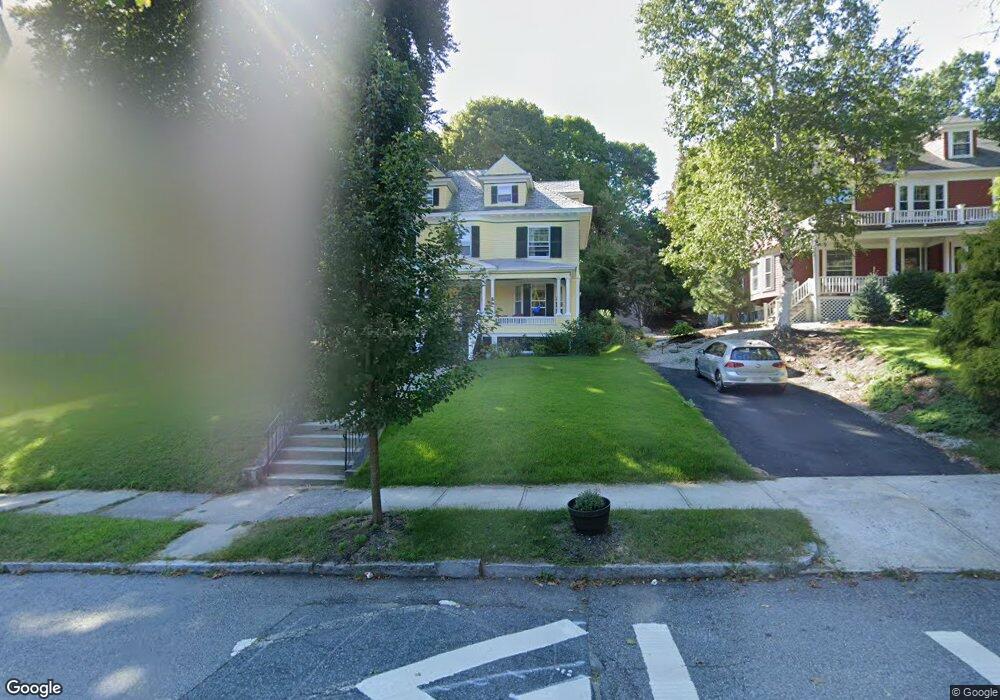
17 Westland St Unit 17 Worcester, MA 01602
Salisbury Street NeighborhoodEstimated Value: $606,951 - $751,000
6
Beds
4
Baths
2,404
Sq Ft
$277/Sq Ft
Est. Value
About This Home
This home is located at 17 Westland St Unit 17, Worcester, MA 01602 and is currently estimated at $665,738, approximately $276 per square foot. 17 Westland St Unit 17 is a home located in Worcester County with nearby schools including Jacob Hiatt Magnet School, Chandler Magnet, and Midland Street.
Ownership History
Date
Name
Owned For
Owner Type
Purchase Details
Closed on
Jun 19, 2015
Sold by
Croop Marion J
Bought by
Santiago Mark and Santiago Andrea
Current Estimated Value
Home Financials for this Owner
Home Financials are based on the most recent Mortgage that was taken out on this home.
Original Mortgage
$308,655
Outstanding Balance
$239,317
Interest Rate
3.78%
Mortgage Type
New Conventional
Estimated Equity
$426,421
Purchase Details
Closed on
Nov 1, 2012
Sold by
Colorio Lt
Bought by
Croop Marion J
Home Financials for this Owner
Home Financials are based on the most recent Mortgage that was taken out on this home.
Original Mortgage
$251,200
Interest Rate
3.5%
Mortgage Type
New Conventional
Purchase Details
Closed on
Nov 24, 2008
Sold by
Colorio John J
Bought by
Colorio Lt and Colorio John J
Purchase Details
Closed on
Mar 14, 2001
Sold by
Gaudenzi Eleanor E and Ozimek Ricahrd A
Bought by
Colorio John and Colorio Mary
Create a Home Valuation Report for This Property
The Home Valuation Report is an in-depth analysis detailing your home's value as well as a comparison with similar homes in the area
Home Values in the Area
Average Home Value in this Area
Purchase History
| Date | Buyer | Sale Price | Title Company |
|---|---|---|---|
| Santiago Mark | $324,900 | -- | |
| Croop Marion J | $314,000 | -- | |
| Colorio Lt | -- | -- | |
| Colorio John | $157,500 | -- |
Source: Public Records
Mortgage History
| Date | Status | Borrower | Loan Amount |
|---|---|---|---|
| Open | Santiago Mark | $308,655 | |
| Previous Owner | Croop Marion J | $251,200 |
Source: Public Records
Tax History Compared to Growth
Tax History
| Year | Tax Paid | Tax Assessment Tax Assessment Total Assessment is a certain percentage of the fair market value that is determined by local assessors to be the total taxable value of land and additions on the property. | Land | Improvement |
|---|---|---|---|---|
| 2025 | $7,010 | $531,500 | $118,800 | $412,700 |
| 2024 | $6,842 | $497,600 | $118,800 | $378,800 |
| 2023 | $6,609 | $460,900 | $103,300 | $357,600 |
| 2022 | $6,149 | $404,300 | $82,700 | $321,600 |
| 2021 | $6,006 | $368,900 | $66,200 | $302,700 |
| 2020 | $5,987 | $352,200 | $66,100 | $286,100 |
| 2019 | $6,021 | $334,500 | $59,600 | $274,900 |
| 2018 | $5,955 | $314,900 | $59,600 | $255,300 |
| 2017 | $5,833 | $303,500 | $59,600 | $243,900 |
| 2016 | $5,921 | $287,300 | $44,000 | $243,300 |
| 2015 | $5,766 | $287,300 | $44,000 | $243,300 |
| 2014 | -- | $287,200 | $44,000 | $243,200 |
Source: Public Records
Map
Nearby Homes