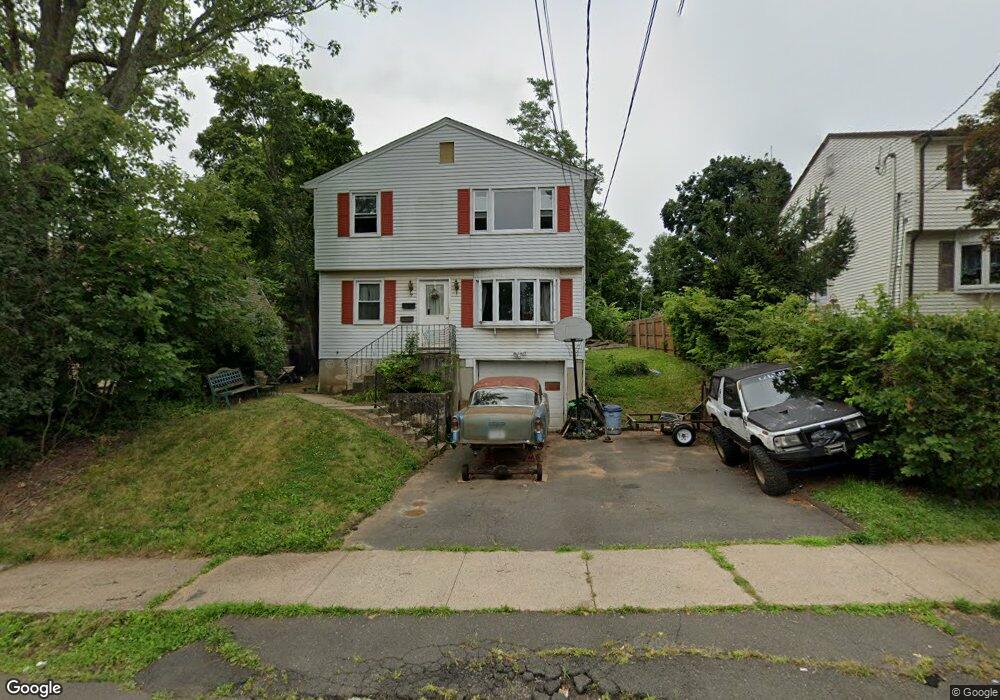
17 Whitman St New Britain, CT 06051
Estimated Value: $304,000 - $506,000
6
Beds
2
Baths
2,314
Sq Ft
$170/Sq Ft
Est. Value
About This Home
This home is located at 17 Whitman St, New Britain, CT 06051 and is currently estimated at $393,504, approximately $170 per square foot. 17 Whitman St is a home located in Hartford County with nearby schools including Slade Middle School, Emmanuel Christian Academy, and Mountain Laurel Sudbury School.
Ownership History
Date
Name
Owned For
Owner Type
Purchase Details
Closed on
Jan 9, 2017
Sold by
Wisniewski Karen S
Bought by
Wisniewski Brandon C
Current Estimated Value
Purchase Details
Closed on
Jul 24, 1995
Sold by
Ridel Vincent and Ridel Kristen
Bought by
Robbins David
Home Financials for this Owner
Home Financials are based on the most recent Mortgage that was taken out on this home.
Original Mortgage
$68,000
Interest Rate
7.49%
Mortgage Type
Unknown
Purchase Details
Closed on
Jan 8, 1990
Sold by
Harris Serena
Bought by
New England Svgs Bk
Create a Home Valuation Report for This Property
The Home Valuation Report is an in-depth analysis detailing your home's value as well as a comparison with similar homes in the area
Home Values in the Area
Average Home Value in this Area
Purchase History
| Date | Buyer | Sale Price | Title Company |
|---|---|---|---|
| Wisniewski Brandon C | -- | -- | |
| Robbins David | $85,000 | -- | |
| New England Svgs Bk | $304,000 | -- |
Source: Public Records
Mortgage History
| Date | Status | Borrower | Loan Amount |
|---|---|---|---|
| Previous Owner | New England Svgs Bk | $68,000 |
Source: Public Records
Tax History Compared to Growth
Tax History
| Year | Tax Paid | Tax Assessment Tax Assessment Total Assessment is a certain percentage of the fair market value that is determined by local assessors to be the total taxable value of land and additions on the property. | Land | Improvement |
|---|---|---|---|---|
| 2025 | $6,662 | $170,030 | $43,540 | $126,490 |
| 2024 | $6,731 | $170,030 | $43,540 | $126,490 |
| 2023 | $6,509 | $170,030 | $43,540 | $126,490 |
| 2022 | $5,800 | $117,180 | $20,020 | $97,160 |
| 2021 | $5,800 | $117,180 | $20,020 | $97,160 |
| 2020 | $5,918 | $117,180 | $20,020 | $97,160 |
| 2019 | $5,918 | $117,180 | $20,020 | $97,160 |
| 2018 | $5,918 | $117,180 | $20,020 | $97,160 |
| 2017 | $5,780 | $114,450 | $20,020 | $94,430 |
| 2016 | $5,780 | $114,450 | $20,020 | $94,430 |
| 2015 | $5,608 | $114,450 | $20,020 | $94,430 |
| 2014 | $5,608 | $114,450 | $20,020 | $94,430 |
Source: Public Records
Map
Nearby Homes