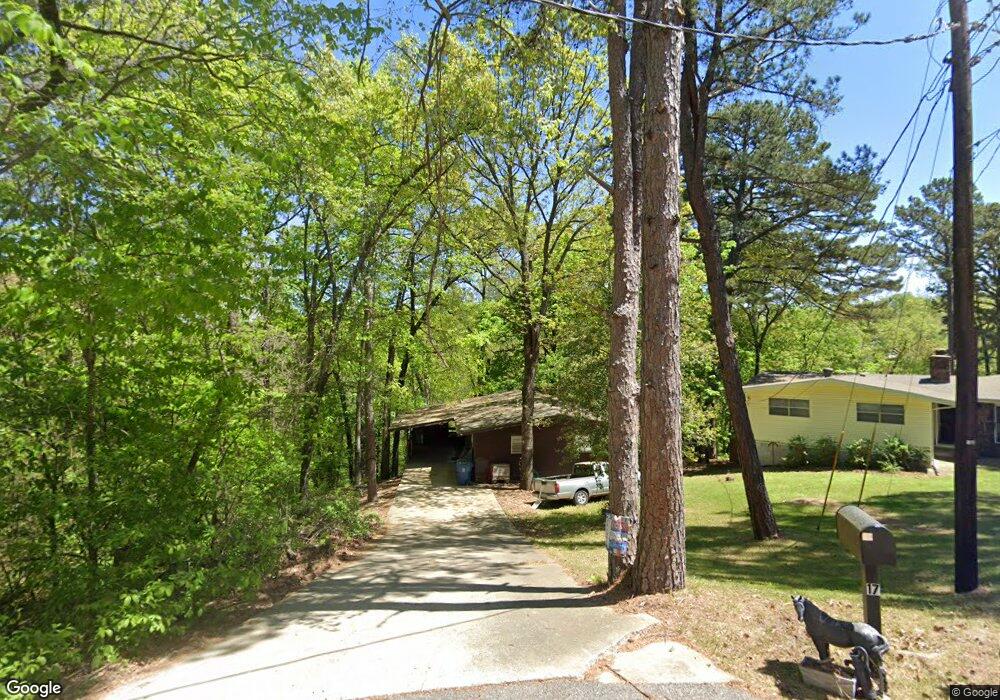
17 Wigston Ln Bella Vista, AR 72714
Estimated Value: $183,301 - $241,000
--
Bed
2
Baths
1,024
Sq Ft
$210/Sq Ft
Est. Value
About This Home
This home is located at 17 Wigston Ln, Bella Vista, AR 72714 and is currently estimated at $214,825, approximately $209 per square foot. 17 Wigston Ln is a home located in Benton County with nearby schools including Cooper Elementary School, Old High Middle School, and Washington Junior High School.
Ownership History
Date
Name
Owned For
Owner Type
Purchase Details
Closed on
Sep 12, 2017
Sold by
Beebe Kenneth R and Kenneth R Beebe Trust
Bought by
Davis Payton and Davis Ashley
Current Estimated Value
Home Financials for this Owner
Home Financials are based on the most recent Mortgage that was taken out on this home.
Original Mortgage
$63,331
Outstanding Balance
$53,715
Interest Rate
4.5%
Mortgage Type
FHA
Estimated Equity
$161,110
Purchase Details
Closed on
Sep 8, 2017
Sold by
Beebe Kenneth R and Kenneth R Beebe Trust
Bought by
Davis Payton and Davis Ashley
Home Financials for this Owner
Home Financials are based on the most recent Mortgage that was taken out on this home.
Original Mortgage
$63,331
Outstanding Balance
$53,715
Interest Rate
4.5%
Mortgage Type
FHA
Estimated Equity
$161,110
Purchase Details
Closed on
May 6, 1988
Bought by
Beebe
Create a Home Valuation Report for This Property
The Home Valuation Report is an in-depth analysis detailing your home's value as well as a comparison with similar homes in the area
Home Values in the Area
Average Home Value in this Area
Purchase History
| Date | Buyer | Sale Price | Title Company |
|---|---|---|---|
| Davis Payton | $64,500 | City Title & Closing Llc | |
| Davis Payton | $64,500 | City Title & Closing Llc | |
| Beebe | $18,000 | -- |
Source: Public Records
Mortgage History
| Date | Status | Borrower | Loan Amount |
|---|---|---|---|
| Open | Beebe | $63,331 | |
| Closed | Davis Payton | $63,331 |
Source: Public Records
Tax History Compared to Growth
Tax History
| Year | Tax Paid | Tax Assessment Tax Assessment Total Assessment is a certain percentage of the fair market value that is determined by local assessors to be the total taxable value of land and additions on the property. | Land | Improvement |
|---|---|---|---|---|
| 2025 | $935 | $26,972 | $1,600 | $25,372 |
| 2024 | $883 | $26,972 | $1,600 | $25,372 |
| 2023 | $840 | $15,620 | $800 | $14,820 |
| 2022 | $454 | $15,620 | $800 | $14,820 |
| 2021 | $415 | $15,620 | $800 | $14,820 |
| 2020 | $384 | $11,910 | $600 | $11,310 |
| 2019 | $384 | $11,910 | $600 | $11,310 |
| 2018 | $409 | $11,910 | $600 | $11,310 |
| 2017 | $730 | $11,910 | $600 | $11,310 |
| 2016 | $730 | $11,910 | $600 | $11,310 |
| 2015 | $665 | $11,020 | $1,000 | $10,020 |
| 2014 | $665 | $11,020 | $1,000 | $10,020 |
Source: Public Records
Map
Nearby Homes
- Lot 40 of Block 1 Leicester Dr
- Lot 19 of Block 1 Leicester Dr
- 0 Bosworth Cir
- Lot 9 of Block 8 Bosworth Cir
- Lot 6 Bosworth Cir
- Lot 9, Block 9 Bosworth Cir
- 0 Ashby Ln
- 32 Saint Austell Dr
- 14 Pickering Dr
- LOT 30 Saint Ives Cir
- Lot 15 Heanor Ln
- 1 Syston Ln
- 41 Pickering Dr
- 21 Castleford Dr
- Lot 45 York Dr
- 2 Stewkley Ln
- TBD Ouse Ln
- LOT 6 Wolverton Ln
- 0 Wolverton Ln
- 23 Bridlington Dr