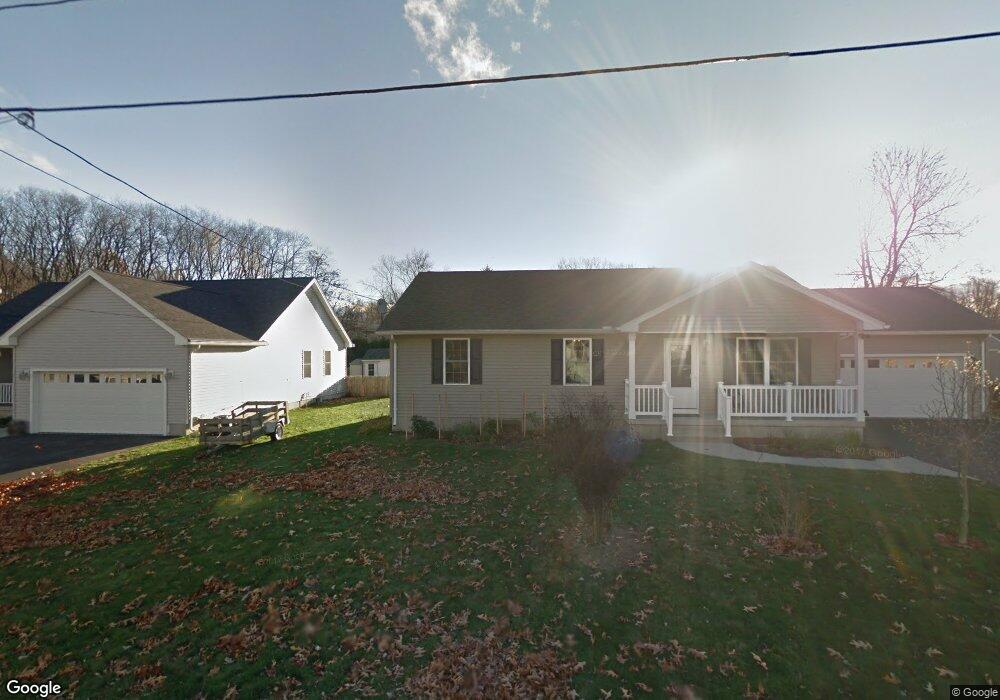
17 Wilmont St Chicopee, MA 01013
Aldenville NeighborhoodEstimated Value: $347,000 - $386,000
3
Beds
2
Baths
1,120
Sq Ft
$330/Sq Ft
Est. Value
About This Home
This home is located at 17 Wilmont St, Chicopee, MA 01013 and is currently estimated at $369,580, approximately $329 per square foot. 17 Wilmont St is a home located in Hampden County with nearby schools including Lambert-Lavoie Elementary School, Fairview Middle School, and Chicopee Comprehensive High School.
Ownership History
Date
Name
Owned For
Owner Type
Purchase Details
Closed on
Jun 20, 2018
Sold by
Sweet Karlton G and Block Harriette S
Bought by
Sweet-Block Ft
Current Estimated Value
Purchase Details
Closed on
Mar 29, 2010
Sold by
Labrie David C
Bought by
Sweet Karlton G and Block Harriette S
Home Financials for this Owner
Home Financials are based on the most recent Mortgage that was taken out on this home.
Original Mortgage
$130,000
Interest Rate
5.02%
Mortgage Type
Purchase Money Mortgage
Purchase Details
Closed on
Nov 5, 2009
Sold by
Obuchowski Joseph and Obuchowski Rose
Bought by
Labrie David C
Purchase Details
Closed on
Jun 6, 2008
Sold by
Obuchowski Joseph and Obuchowski Anthony L
Bought by
Obuchowski Rose and Obuchowski Joseph
Home Financials for this Owner
Home Financials are based on the most recent Mortgage that was taken out on this home.
Original Mortgage
$144,130
Interest Rate
6.11%
Mortgage Type
Purchase Money Mortgage
Create a Home Valuation Report for This Property
The Home Valuation Report is an in-depth analysis detailing your home's value as well as a comparison with similar homes in the area
Home Values in the Area
Average Home Value in this Area
Purchase History
| Date | Buyer | Sale Price | Title Company |
|---|---|---|---|
| Sweet-Block Ft | -- | -- | |
| Sweet Karlton G | $240,000 | -- | |
| Labrie David C | $60,000 | -- | |
| Obuchowski Rose | -- | -- |
Source: Public Records
Mortgage History
| Date | Status | Borrower | Loan Amount |
|---|---|---|---|
| Previous Owner | Sweet Karlton G | $130,000 | |
| Previous Owner | Obuchowski Rose | $144,130 |
Source: Public Records
Tax History Compared to Growth
Tax History
| Year | Tax Paid | Tax Assessment Tax Assessment Total Assessment is a certain percentage of the fair market value that is determined by local assessors to be the total taxable value of land and additions on the property. | Land | Improvement |
|---|---|---|---|---|
| 2025 | $5,304 | $349,900 | $105,400 | $244,500 |
| 2024 | $5,066 | $343,200 | $103,300 | $239,900 |
| 2023 | $4,731 | $312,300 | $93,900 | $218,400 |
| 2022 | $4,531 | $266,700 | $81,700 | $185,000 |
| 2021 | $4,399 | $249,800 | $74,300 | $175,500 |
| 2020 | $4,147 | $237,500 | $73,600 | $163,900 |
| 2019 | $4,055 | $225,800 | $73,600 | $152,200 |
| 2018 | $3,960 | $216,300 | $70,000 | $146,300 |
| 2017 | $3,441 | $198,800 | $65,200 | $133,600 |
| 2016 | $3,419 | $202,200 | $65,200 | $137,000 |
| 2015 | $3,541 | $201,900 | $65,200 | $136,700 |
| 2014 | $1,771 | $201,900 | $65,200 | $136,700 |
Source: Public Records
Map
Nearby Homes
- 19 Dale Ct
- 26 Olivine St
- 757 Chicopee St
- 20 Mount Carmel Ave
- 15 Riverview Place
- 599 Chicopee St
- 21 Tourtelotte Ave
- 10 Rivest Ct
- 199 Meadow St
- 14 Norman St
- 44 Charpentier Blvd
- 664 Mckinstry Ave
- 130 Middle Water St
- 625 Mckinstry Ave
- 1246 Granby Rd Unit 28
- 47 Dorrance St
- 40 Greenwich St
- 175 Pendexter Ave
- 158 Narragansett Blvd
- 1150 Granby Rd