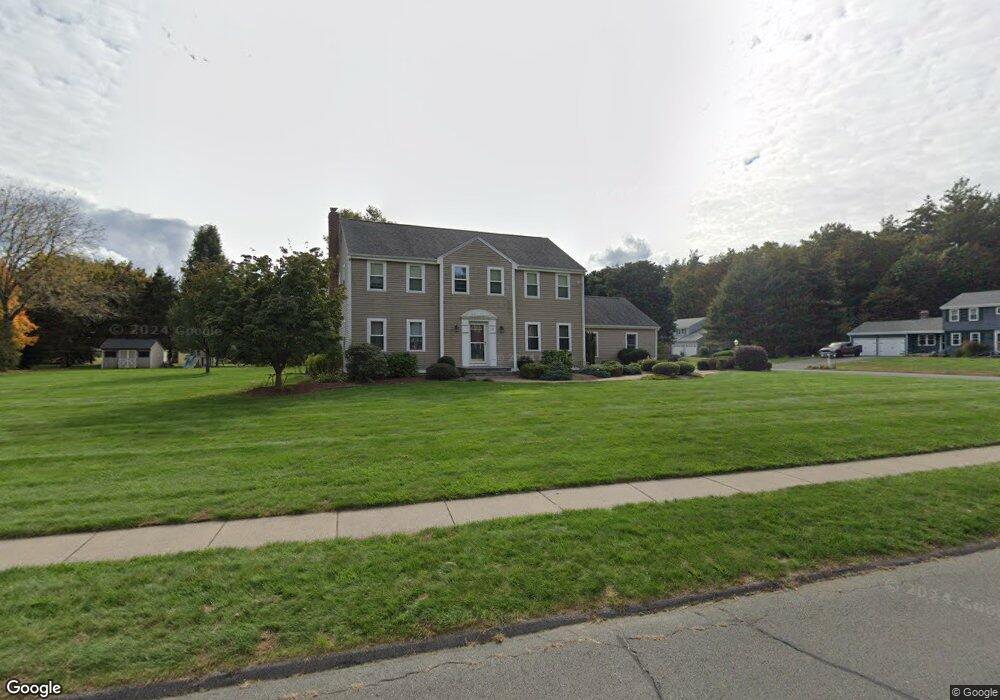
17 Windmill Rd Ellington, CT 06029
Estimated Value: $572,000 - $630,000
4
Beds
3
Baths
2,376
Sq Ft
$250/Sq Ft
Est. Value
About This Home
This home is located at 17 Windmill Rd, Ellington, CT 06029 and is currently estimated at $592,994, approximately $249 per square foot. 17 Windmill Rd is a home located in Tolland County with nearby schools including Ellington High School.
Ownership History
Date
Name
Owned For
Owner Type
Purchase Details
Closed on
Apr 30, 1992
Sold by
Michalak Deborah and Michalak John
Bought by
Miller Mark
Current Estimated Value
Home Financials for this Owner
Home Financials are based on the most recent Mortgage that was taken out on this home.
Original Mortgage
$147,000
Interest Rate
8.96%
Mortgage Type
Unknown
Purchase Details
Closed on
Jun 12, 1987
Sold by
Lacava Construction
Bought by
Michalak John
Create a Home Valuation Report for This Property
The Home Valuation Report is an in-depth analysis detailing your home's value as well as a comparison with similar homes in the area
Home Values in the Area
Average Home Value in this Area
Purchase History
| Date | Buyer | Sale Price | Title Company |
|---|---|---|---|
| Miller Mark | $193,000 | -- | |
| Michalak John | $185,000 | -- |
Source: Public Records
Mortgage History
| Date | Status | Borrower | Loan Amount |
|---|---|---|---|
| Closed | Michalak John | $114,700 | |
| Closed | Michalak John | $147,000 | |
| Closed | Michalak John | $148,000 | |
| Closed | Michalak John | $147,000 |
Source: Public Records
Tax History
| Year | Tax Paid | Tax Assessment Tax Assessment Total Assessment is a certain percentage of the fair market value that is determined by local assessors to be the total taxable value of land and additions on the property. | Land | Improvement |
|---|---|---|---|---|
| 2025 | $8,963 | $241,600 | $62,400 | $179,200 |
| 2024 | $8,698 | $241,600 | $62,400 | $179,200 |
| 2023 | $8,287 | $241,600 | $62,400 | $179,200 |
| 2022 | $7,852 | $241,600 | $62,400 | $179,200 |
| 2021 | $7,635 | $241,600 | $62,400 | $179,200 |
| 2020 | $7,784 | $238,780 | $62,300 | $176,480 |
| 2019 | $7,784 | $238,780 | $62,300 | $176,480 |
| 2016 | $7,283 | $238,780 | $62,300 | $176,480 |
| 2015 | $7,283 | $234,750 | $62,300 | $172,450 |
| 2014 | $6,656 | $231,930 | $62,300 | $169,630 |
Source: Public Records
Map
Nearby Homes
- 96 Muddy Brook Rd
- 37 Ellsworth Ln
- 58 Maple St
- 33 Lanz Ln
- 3 Meagan Cir
- 0 Porter Rd
- 160 East Rd
- 164 East Rd
- 164 Pinney St
- 41 Cider Mill Rd
- 183 Chamberlain Rd
- 222 Mountain Rd
- 4 Jessie Ln
- 77 Thrall Rd
- 56 Highland Ave
- 6 Setting Sun Trail
- 2 Setting Sun Trail
- 178 Crystal Lake Rd
- 13 Reservoir Ave
- 11 Settlers Way
Your Personal Tour Guide
Ask me questions while you tour the home.