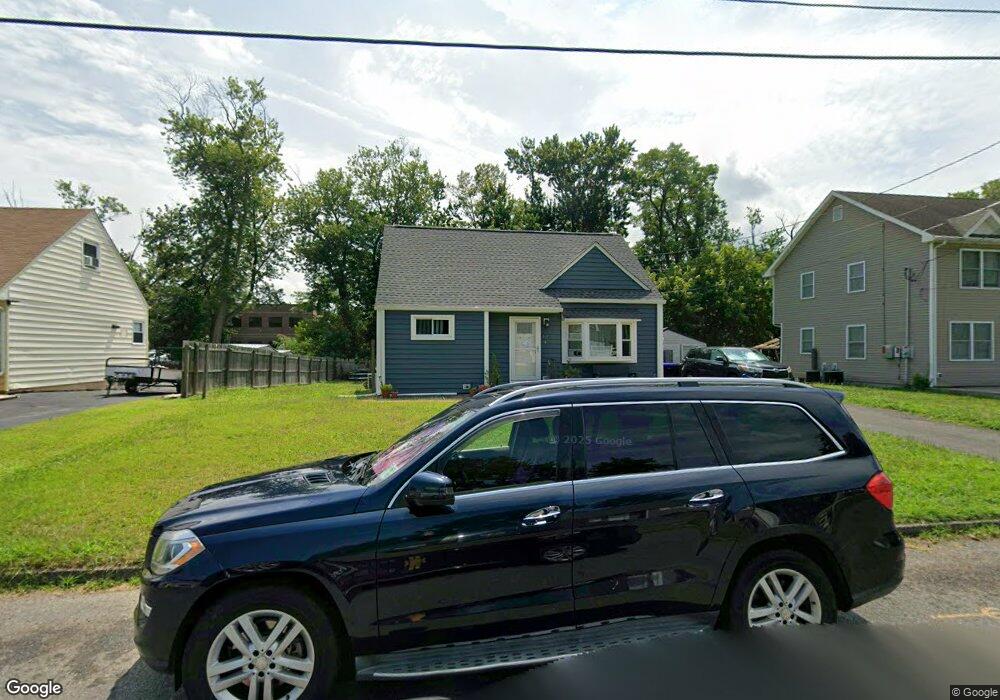
17 Windsor Dr East Brunswick, NJ 08816
Estimated Value: $388,121 - $530,000
3
Beds
1
Bath
1,212
Sq Ft
$397/Sq Ft
Est. Value
About This Home
This home is located at 17 Windsor Dr, East Brunswick, NJ 08816 and is currently estimated at $480,780, approximately $396 per square foot. 17 Windsor Dr is a home located in Middlesex County with nearby schools including Murray A. Chittick Elementary School, Hammarskjold Upper Elementary School, and Churchill Junior High School.
Ownership History
Date
Name
Owned For
Owner Type
Purchase Details
Closed on
Aug 24, 2016
Sold by
Essig Michael and Essig Bonnie
Bought by
Cruz Jummy Dela
Current Estimated Value
Purchase Details
Closed on
Jun 6, 2010
Sold by
Guerin Mark and Guerin Valerie
Bought by
Essig Michael Robert and Essig Bonnie
Home Financials for this Owner
Home Financials are based on the most recent Mortgage that was taken out on this home.
Original Mortgage
$232,750
Interest Rate
5.11%
Mortgage Type
New Conventional
Purchase Details
Closed on
Apr 22, 2004
Sold by
Paddilla Grace
Bought by
Guerin Mark and Guerin Valerie
Home Financials for this Owner
Home Financials are based on the most recent Mortgage that was taken out on this home.
Original Mortgage
$184,000
Interest Rate
5.75%
Purchase Details
Closed on
May 6, 1997
Sold by
Hovnanian K
Bought by
Muller Robert and Muller Martha
Create a Home Valuation Report for This Property
The Home Valuation Report is an in-depth analysis detailing your home's value as well as a comparison with similar homes in the area
Home Values in the Area
Average Home Value in this Area
Purchase History
| Date | Buyer | Sale Price | Title Company |
|---|---|---|---|
| Cruz Jummy Dela | $265,000 | Montgoery Hills Title Servic | |
| Essig Michael Robert | $245,000 | Multiple | |
| Guerin Mark | $230,000 | -- | |
| Muller Robert | $175,700 | -- |
Source: Public Records
Mortgage History
| Date | Status | Borrower | Loan Amount |
|---|---|---|---|
| Previous Owner | Essig Michael Robert | $232,750 | |
| Previous Owner | Guerin Mark | $184,000 |
Source: Public Records
Tax History Compared to Growth
Tax History
| Year | Tax Paid | Tax Assessment Tax Assessment Total Assessment is a certain percentage of the fair market value that is determined by local assessors to be the total taxable value of land and additions on the property. | Land | Improvement |
|---|---|---|---|---|
| 2025 | $7,390 | $60,600 | $18,900 | $41,700 |
| 2024 | $7,169 | $60,600 | $18,900 | $41,700 |
| 2023 | $7,169 | $60,600 | $18,900 | $41,700 |
| 2022 | $7,141 | $60,600 | $18,900 | $41,700 |
| 2021 | $6,937 | $60,600 | $18,900 | $41,700 |
| 2020 | $6,927 | $60,600 | $18,900 | $41,700 |
| 2019 | $6,853 | $60,600 | $18,900 | $41,700 |
| 2018 | $6,737 | $60,600 | $18,900 | $41,700 |
| 2017 | $6,628 | $60,600 | $18,900 | $41,700 |
| 2016 | $6,087 | $56,800 | $18,900 | $37,900 |
| 2015 | $5,944 | $56,800 | $18,900 | $37,900 |
| 2014 | $5,816 | $56,800 | $18,900 | $37,900 |
Source: Public Records
Map
Nearby Homes