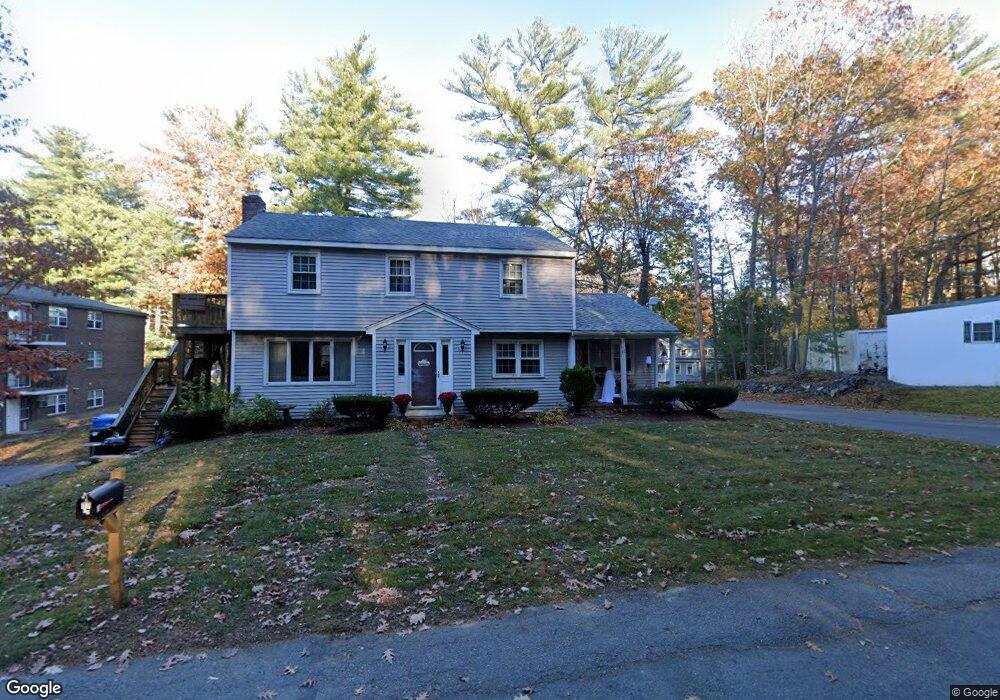
17 Winter St Merrimac, MA 01860
Estimated Value: $606,000 - $740,000
4
Beds
2
Baths
2,052
Sq Ft
$330/Sq Ft
Est. Value
About This Home
This home is located at 17 Winter St, Merrimac, MA 01860 and is currently estimated at $676,238, approximately $329 per square foot. 17 Winter St is a home located in Essex County with nearby schools including Pentucket Regional High School.
Ownership History
Date
Name
Owned For
Owner Type
Purchase Details
Closed on
Sep 30, 2025
Sold by
Peter C Sullivan Ret 2017 and Sullivan
Bought by
Willis Alexander C and Willis Wendy
Current Estimated Value
Home Financials for this Owner
Home Financials are based on the most recent Mortgage that was taken out on this home.
Original Mortgage
$552,500
Outstanding Balance
$552,008
Interest Rate
6.58%
Mortgage Type
New Conventional
Estimated Equity
$124,230
Purchase Details
Closed on
Jul 14, 2017
Sold by
Sullivan Peter C
Bought by
Peter C Sullivan Ret 2 and Sullivan
Purchase Details
Closed on
Mar 13, 2001
Sold by
Sanborn Scott E
Bought by
Sullivan Peter
Purchase Details
Closed on
Dec 31, 1992
Sold by
Lloyd Trust
Bought by
Sanborn Scott E
Create a Home Valuation Report for This Property
The Home Valuation Report is an in-depth analysis detailing your home's value as well as a comparison with similar homes in the area
Home Values in the Area
Average Home Value in this Area
Purchase History
| Date | Buyer | Sale Price | Title Company |
|---|---|---|---|
| Willis Alexander C | $650,000 | -- | |
| Peter C Sullivan Ret 2 | -- | -- | |
| Sullivan Peter | $225,000 | -- | |
| Sanborn Scott E | $108,000 | -- |
Source: Public Records
Mortgage History
| Date | Status | Borrower | Loan Amount |
|---|---|---|---|
| Open | Willis Alexander C | $552,500 | |
| Previous Owner | Sanborn Scott E | $210,000 | |
| Previous Owner | Sanborn Scott E | $61,000 | |
| Previous Owner | Sanborn Scott E | $244,000 |
Source: Public Records
Tax History Compared to Growth
Tax History
| Year | Tax Paid | Tax Assessment Tax Assessment Total Assessment is a certain percentage of the fair market value that is determined by local assessors to be the total taxable value of land and additions on the property. | Land | Improvement |
|---|---|---|---|---|
| 2025 | $7,497 | $565,800 | $291,400 | $274,400 |
| 2024 | $7,302 | $540,900 | $275,200 | $265,700 |
| 2023 | $6,725 | $455,300 | $233,100 | $222,200 |
| 2022 | $6,216 | $380,400 | $187,800 | $192,600 |
| 2021 | $5,936 | $364,200 | $171,600 | $192,600 |
| 2020 | $5,419 | $364,200 | $171,600 | $192,600 |
| 2019 | $5,164 | $326,600 | $148,900 | $177,700 |
| 2018 | $4,938 | $313,300 | $139,200 | $174,100 |
| 2017 | $4,662 | $285,300 | $116,600 | $168,700 |
| 2016 | $4,552 | $281,700 | $116,600 | $165,100 |
| 2015 | $4,381 | $269,600 | $116,600 | $153,000 |
| 2014 | $4,284 | $269,600 | $116,600 | $153,000 |
Source: Public Records
Map
Nearby Homes