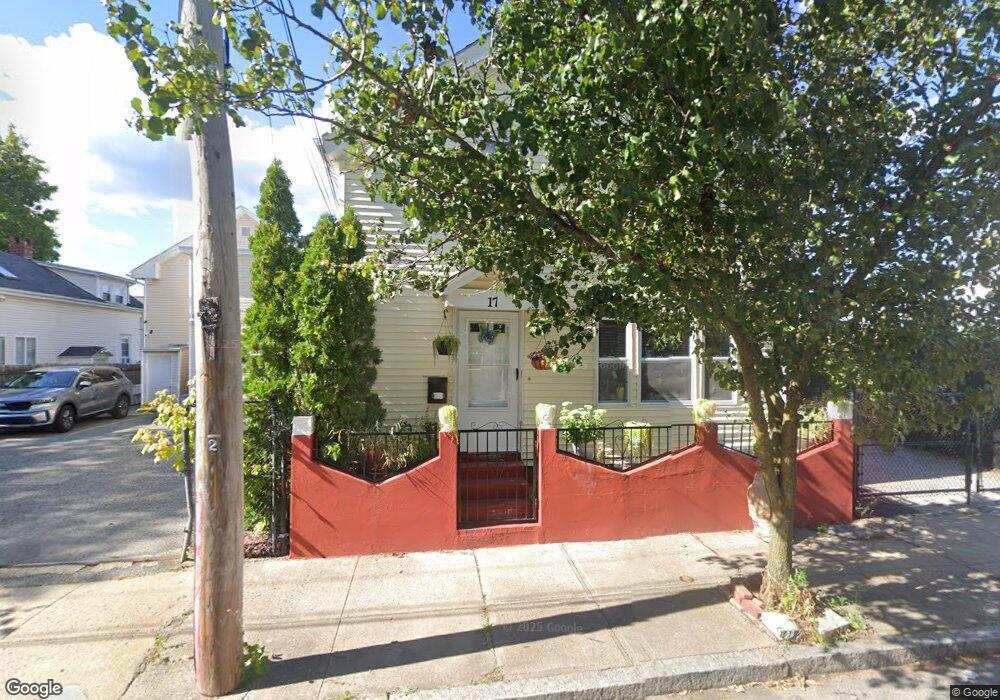
17 Wyatt St Providence, RI 02905
Lower South Providence NeighborhoodEstimated Value: $386,624 - $527,000
4
Beds
2
Baths
1,328
Sq Ft
$337/Sq Ft
Est. Value
About This Home
This home is located at 17 Wyatt St, Providence, RI 02905 and is currently estimated at $447,656, approximately $337 per square foot. 17 Wyatt St is a home located in Providence County with nearby schools including Asa Messer Elementary School, Charles N. Fortes Elementary School, and Robert L. Bailey IV Elementary.
Ownership History
Date
Name
Owned For
Owner Type
Purchase Details
Closed on
Jul 18, 2023
Sold by
Acevedo Cleotilde
Bought by
Balbuena Cleotilde and Acevedo Juan C
Current Estimated Value
Create a Home Valuation Report for This Property
The Home Valuation Report is an in-depth analysis detailing your home's value as well as a comparison with similar homes in the area
Home Values in the Area
Average Home Value in this Area
Purchase History
| Date | Buyer | Sale Price | Title Company |
|---|---|---|---|
| Balbuena Cleotilde | -- | None Available |
Source: Public Records
Tax History Compared to Growth
Tax History
| Year | Tax Paid | Tax Assessment Tax Assessment Total Assessment is a certain percentage of the fair market value that is determined by local assessors to be the total taxable value of land and additions on the property. | Land | Improvement |
|---|---|---|---|---|
| 2025 | $2,627 | $347,900 | $118,500 | $229,400 |
| 2024 | $4,332 | $236,100 | $75,000 | $161,100 |
| 2023 | $4,332 | $236,100 | $75,000 | $161,100 |
| 2022 | $4,203 | $236,100 | $75,000 | $161,100 |
| 2021 | $2,918 | $118,800 | $33,100 | $85,700 |
| 2020 | $2,918 | $118,800 | $33,100 | $85,700 |
| 2019 | $2,918 | $118,800 | $33,100 | $85,700 |
| 2018 | $3,023 | $94,600 | $30,100 | $64,500 |
| 2017 | $3,023 | $94,600 | $30,100 | $64,500 |
| 2016 | $3,023 | $94,600 | $30,100 | $64,500 |
| 2015 | $2,767 | $83,600 | $30,100 | $53,500 |
| 2014 | $2,822 | $83,600 | $30,100 | $53,500 |
| 2013 | $2,822 | $83,600 | $30,100 | $53,500 |
Source: Public Records
Map
Nearby Homes