
Seller's Agent in 2025
Peter Hunt
ACTION PLUS REALTY C-21
(908) 601-4934
40 in this area
88 Total Sales
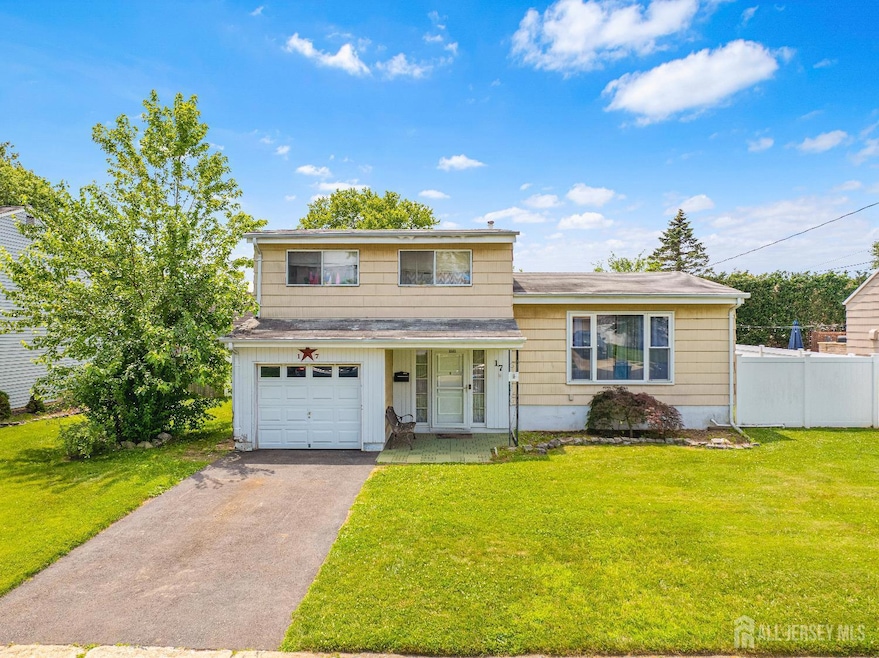
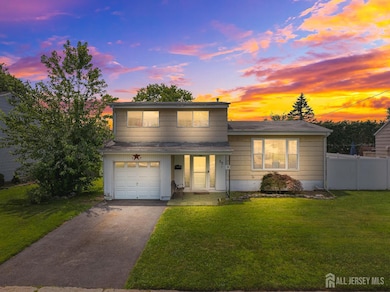
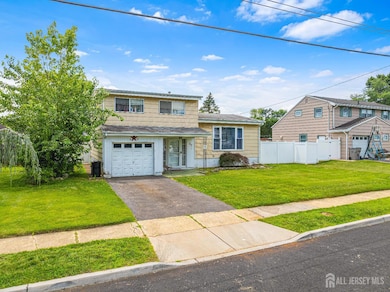
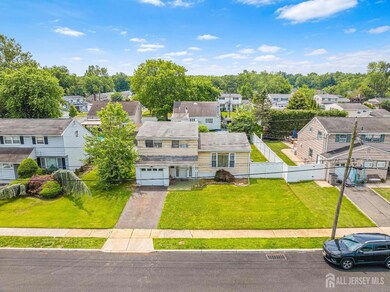
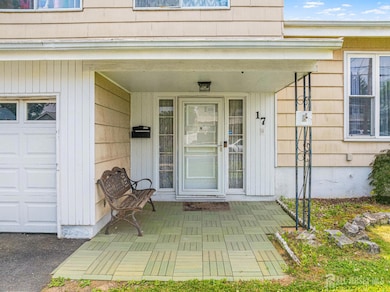
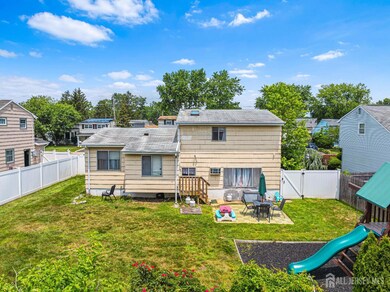
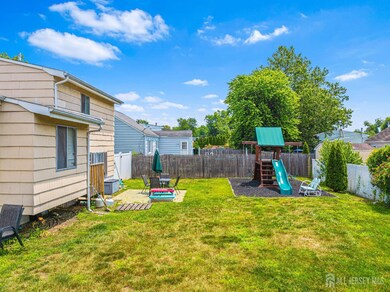
This is it. The SHARPEST price point in Sayrewoods South. This SPACEMAKER split-level is the perfect home to get you into Old Bridge's largest and most coveted neighborhood. The entry-level foyer and family room have updated flooring. The entry level also offers a half bathroom. Step up into the living room with hardwood flooring and a spacious dining room. The kitchen is clean and functional with granite countertops. The upper level of the house boasts three bedrooms with hardwood flooring and your full family bathroom. The basement offers mechanicals, laundry hookups, and plenty of storage space. Fenced yard with patio and a GREAT Swing Set! Bring your vision and make this great house your Great Home. There may still be time to be situated for the 2025/2026 school year. Act Now! The home is being offered as is. The seller is not offering credits or doing repairs.
| Date | Type | Sale Price | Title Company |
|---|---|---|---|
| Deed | $335,000 | Noble Title Agency Inc | |
| Deed | $265,000 | Commonwealth Title |
| Date | Status | Loan Amount | Loan Type |
|---|---|---|---|
| Previous Owner | $260,200 | FHA | |
| Closed | $0 | VA |
| Date | Event | Price | List to Sale | Price per Sq Ft |
|---|---|---|---|---|
| 10/03/2025 10/03/25 | Sold | $560,000 | +13.1% | $366 / Sq Ft |
| 07/03/2025 07/03/25 | For Sale | $495,000 | -- | $324 / Sq Ft |
| Year | Tax Paid | Tax Assessment Tax Assessment Total Assessment is a certain percentage of the fair market value that is determined by local assessors to be the total taxable value of land and additions on the property. | Land | Improvement |
|---|---|---|---|---|
| 2025 | $8,408 | $148,900 | $69,000 | $79,900 |
| 2024 | $8,066 | $148,900 | $69,000 | $79,900 |
| 2023 | $8,066 | $148,900 | $69,000 | $79,900 |
| 2022 | $7,881 | $148,900 | $69,000 | $79,900 |
| 2021 | $5,784 | $148,900 | $69,000 | $79,900 |
| 2020 | $7,649 | $148,900 | $69,000 | $79,900 |
| 2019 | $7,519 | $148,900 | $69,000 | $79,900 |
| 2018 | $7,436 | $148,900 | $69,000 | $79,900 |
| 2017 | $7,122 | $147,400 | $69,000 | $78,400 |
| 2016 | $6,975 | $147,400 | $69,000 | $78,400 |
| 2015 | $6,354 | $147,400 | $69,000 | $78,400 |
| 2014 | $6,285 | $147,400 | $69,000 | $78,400 |
Seller's Agent in 2025
Peter Hunt
ACTION PLUS REALTY C-21
(908) 601-4934
40 in this area
88 Total Sales
Source: All Jersey MLS
MLS Number: 2516240R
APN: 15-15582-0000-00502
Disclaimer: Certain information contained herein is derived from information provided by parties other than Homes.com. All information provided is deemed reliable, but is not guaranteed to be accurate and should be independently verified.
![]() The data relating to real estate for sale on this web-site comes in part from the Internet Listing Display database of the CENTRAL JERSEY MULTIPLE LISTING SYSTEM, INC. Real estate listings held by brokerage firms other than this site-owner are marked with the ILD logo. The CENTRAL JERSEY MULTIPLE LISTING SYSTEM, INC does not warrant the accuracy, quality, reliability, suitability, completeness, usefulness or effectiveness of any information provided.
The data relating to real estate for sale on this web-site comes in part from the Internet Listing Display database of the CENTRAL JERSEY MULTIPLE LISTING SYSTEM, INC. Real estate listings held by brokerage firms other than this site-owner are marked with the ILD logo. The CENTRAL JERSEY MULTIPLE LISTING SYSTEM, INC does not warrant the accuracy, quality, reliability, suitability, completeness, usefulness or effectiveness of any information provided.
Copyright 2025, CENTRAL JERSEY MULTIPLE LISTING SYSTEM, INC All rights reserved
The CENTRAL JERSEY MULTIPLE LISTING SYSTEM, INC retains all rights, title and interest in and to its trademarks, service marks and copyrighted material.
The information being provided is for consumers' personal, non-commercial use and may not be used for any purpose other than to identify properties the consumer may be interested in purchasing or renting.