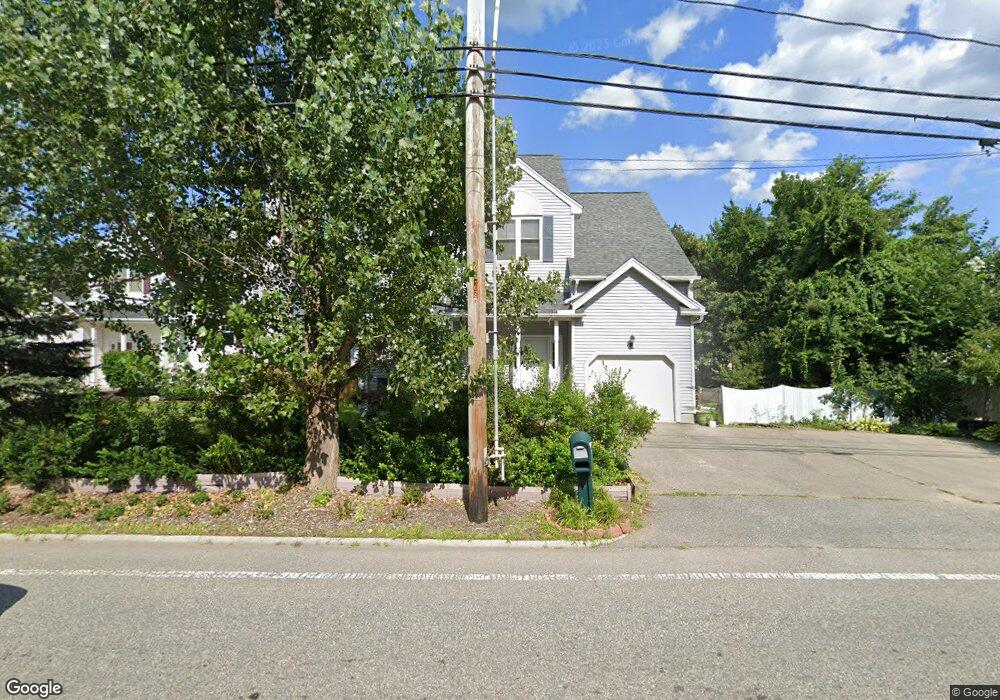
170 Andover Bypass St North Andover, MA 01845
Estimated Value: $730,000 - $821,000
2
Beds
3
Baths
1,994
Sq Ft
$383/Sq Ft
Est. Value
About This Home
This home is located at 170 Andover Bypass St, North Andover, MA 01845 and is currently estimated at $763,185, approximately $382 per square foot. 170 Andover Bypass St is a home located in Essex County with nearby schools including Franklin Elementary School, North Andover Middle School, and North Andover High School.
Ownership History
Date
Name
Owned For
Owner Type
Purchase Details
Closed on
Jul 1, 2010
Sold by
Massachusetts Res Nt
Bought by
Dang Macbinh and Dang Thanhthuy
Current Estimated Value
Home Financials for this Owner
Home Financials are based on the most recent Mortgage that was taken out on this home.
Original Mortgage
$150,000
Outstanding Balance
$100,471
Interest Rate
4.88%
Mortgage Type
Purchase Money Mortgage
Estimated Equity
$662,714
Purchase Details
Closed on
Dec 30, 1996
Sold by
Quest Enterprises Inc
Bought by
Hampton Daniel K
Home Financials for this Owner
Home Financials are based on the most recent Mortgage that was taken out on this home.
Original Mortgage
$181,450
Interest Rate
7.55%
Mortgage Type
Purchase Money Mortgage
Create a Home Valuation Report for This Property
The Home Valuation Report is an in-depth analysis detailing your home's value as well as a comparison with similar homes in the area
Home Values in the Area
Average Home Value in this Area
Purchase History
| Date | Buyer | Sale Price | Title Company |
|---|---|---|---|
| Dang Macbinh | $335,000 | -- | |
| Massachusetts Res Nt | $335,000 | -- | |
| Hampton Daniel K | $191,016 | -- |
Source: Public Records
Mortgage History
| Date | Status | Borrower | Loan Amount |
|---|---|---|---|
| Open | Dang Macbinh | $150,000 | |
| Previous Owner | Hampton Daniel K | $305,608 | |
| Previous Owner | Hampton Daniel K | $176,500 | |
| Previous Owner | Hampton Daniel K | $178,500 | |
| Previous Owner | Hampton Daniel K | $181,450 |
Source: Public Records
Tax History Compared to Growth
Tax History
| Year | Tax Paid | Tax Assessment Tax Assessment Total Assessment is a certain percentage of the fair market value that is determined by local assessors to be the total taxable value of land and additions on the property. | Land | Improvement |
|---|---|---|---|---|
| 2025 | $6,512 | $578,300 | $219,200 | $359,100 |
| 2024 | $6,215 | $560,400 | $206,300 | $354,100 |
| 2023 | $6,148 | $502,300 | $189,500 | $312,800 |
| 2022 | $5,923 | $437,800 | $170,200 | $267,600 |
| 2021 | $5,702 | $402,400 | $154,700 | $247,700 |
| 2020 | $5,529 | $402,400 | $154,700 | $247,700 |
| 2019 | $5,396 | $402,400 | $154,700 | $247,700 |
| 2018 | $5,847 | $402,400 | $154,700 | $247,700 |
| 2017 | $5,048 | $353,500 | $130,600 | $222,900 |
| 2016 | $4,796 | $336,100 | $128,100 | $208,000 |
| 2015 | $4,836 | $336,100 | $123,700 | $212,400 |
Source: Public Records
Map
Nearby Homes
- 204 Chestnut St
- 124 Hillside Rd
- 76 Hillside Rd
- 32 Lucerne Dr
- 105 Elm St Unit A
- 124 Quail Run Rd
- 136 Quail Run Rd
- 495 Johnson St
- 80 Sandra Ln
- 174 Chestnut St Unit 14
- 61 Elm St Unit 61
- 12 Farnum St
- 170 Haverhill St Unit 138
- 10 Maple Ave Unit 3
- 20 Walnut Ave
- 9 Chapman Ave
- 1 Longwood Dr Unit 105
- 156 High St
- 4 Buchan Rd
- Lot 7 Weeping Willow Dr