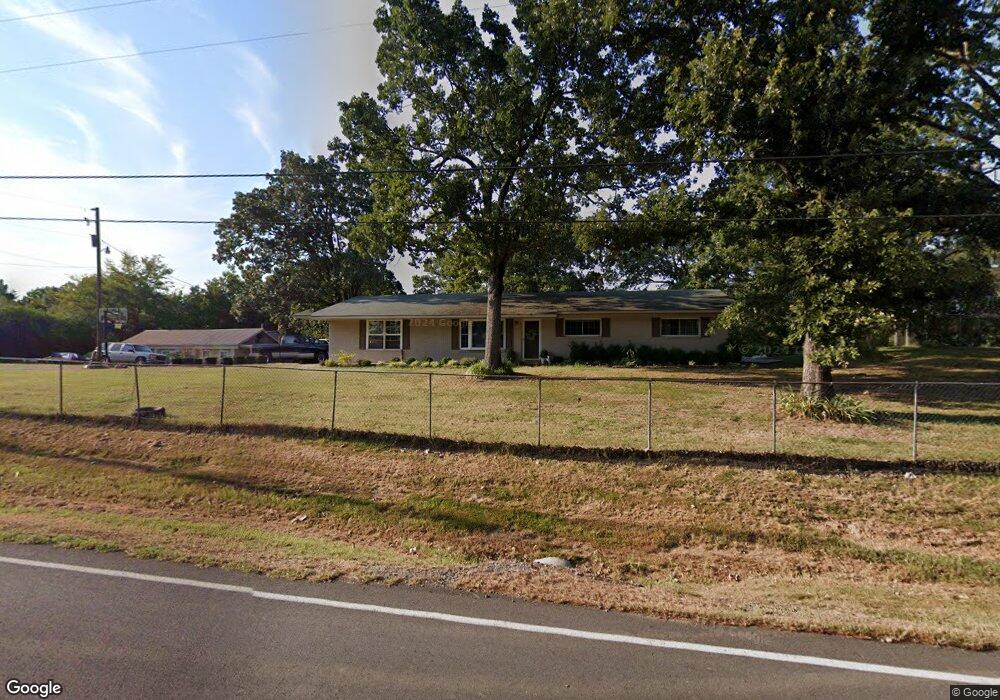
170 Beaverfork Rd Conway, AR 72032
Estimated Value: $297,019 - $445,000
Studio
2
Baths
2,835
Sq Ft
$123/Sq Ft
Est. Value
About This Home
This home is located at 170 Beaverfork Rd, Conway, AR 72032 and is currently estimated at $347,673, approximately $122 per square foot. 170 Beaverfork Rd is a home located in Faulkner County with nearby schools including Theodore Jones Elementary School, Conway Junior High School, and Conway High School.
Ownership History
Date
Name
Owned For
Owner Type
Purchase Details
Closed on
Dec 29, 2022
Sold by
Reynolds Bart
Bought by
Crow Fred and Crow Alicia
Current Estimated Value
Purchase Details
Closed on
May 28, 2014
Sold by
Kendrick Danny Ray and Kendrick Zachary Daniel
Bought by
Kendrick Phyllis Ann and Kendrick Micah Edmond
Purchase Details
Closed on
Aug 29, 2012
Sold by
Reynolds Carolyn Sue
Bought by
Kendrick Danny Ray
Purchase Details
Closed on
Feb 3, 2012
Sold by
Kendrick Betty Sue
Bought by
Kendrick Betty Sue
Purchase Details
Closed on
May 2, 2007
Bought by
Kendrick and Earney
Purchase Details
Closed on
Apr 27, 2007
Bought by
Kendrick and Earney
Purchase Details
Closed on
Nov 18, 2003
Bought by
Kendrick Danny R and Earney Nancy A
Purchase Details
Closed on
Sep 24, 1993
Purchase Details
Closed on
Feb 27, 1990
Bought by
Corrects 439-47
Create a Home Valuation Report for This Property
The Home Valuation Report is an in-depth analysis detailing your home's value as well as a comparison with similar homes in the area
Home Values in the Area
Average Home Value in this Area
Purchase History
| Date | Buyer | Sale Price | Title Company |
|---|---|---|---|
| Crow Fred | -- | -- | |
| Kendrick Phyllis Ann | -- | None Available | |
| Kendrick Danny Ray | -- | None Available | |
| Kendrick Betty Sue | -- | None Available | |
| Kendrick | $155,000 | -- | |
| Kendrick | $155,000 | -- | |
| Kendrick Danny R | -- | -- | |
| -- | $83,000 | -- | |
| Corrects 439-47 | -- | -- |
Source: Public Records
Tax History
| Year | Tax Paid | Tax Assessment Tax Assessment Total Assessment is a certain percentage of the fair market value that is determined by local assessors to be the total taxable value of land and additions on the property. | Land | Improvement |
|---|---|---|---|---|
| 2025 | $1,857 | $65,660 | $4,180 | $61,480 |
| 2024 | $1,801 | $65,660 | $4,180 | $61,480 |
| 2023 | $1,745 | $46,360 | $4,170 | $42,190 |
| 2022 | $1,464 | $46,360 | $4,170 | $42,190 |
| 2021 | $1,377 | $46,360 | $4,170 | $42,190 |
| 2020 | $1,331 | $37,600 | $3,160 | $34,440 |
| 2019 | $1,331 | $37,600 | $3,160 | $34,440 |
| 2018 | $902 | $25,680 | $3,160 | $22,520 |
| 2017 | $902 | $25,680 | $3,160 | $22,520 |
| 2016 | $902 | $25,680 | $3,160 | $22,520 |
| 2015 | $1,139 | $24,540 | $5,150 | $19,390 |
| 2014 | $849 | $24,540 | $5,150 | $19,390 |
Source: Public Records
Map
Nearby Homes
- 70 Beaverfork Rd
- 24 Blue Jay Way
- 200 Waterview Dr
- 2 Lake Point Dr
- Lot 32 Summit Addition Ph 1
- 220 Waterview Dr
- 16 Pinecrest Ct
- 1320 Sawyer Ln
- 1400 Sawyer Ln
- 5 Treasure Hills Rd
- 00 Cadron Gap Rd
- Tract 4 Friendship Rd
- Tract 2 Friendship Rd
- Tract 1 Friendship Rd
- 13 Loyal Ln
- 1501 Dogwood Trail
- 1230 Littlewood Cove
- 3020 Cloudberry Dr
- 3030 Plateau Dr
- 40 Woodruff Ln
- 166 Beaverfork Rd
- 174 Beaverfork Rd
- 171 Beaverfork Rd
- 176 Beaverfork Rd
- 173 Beaverfork Rd
- 162 Beaverfork Rd
- 114 Beaverfork Rd
- 178 Beaverfork Rd
- 159 Beaverfork Rd
- 158 Beaverfork Rd
- 185 Beaverfork Rd
- 154 Beaverfork Rd
- 0 Beaverfork Rd
- 22 Michaels Dr
- 175 Beaverfork Rd
- 175 Beaverfork Rd
- 175 Beaverfork Rd
- 141 Beaverfork Rd
- 90 Beaverfork Rd
- 187 Beaverfork Rd
Your Personal Tour Guide
Ask me questions while you tour the home.