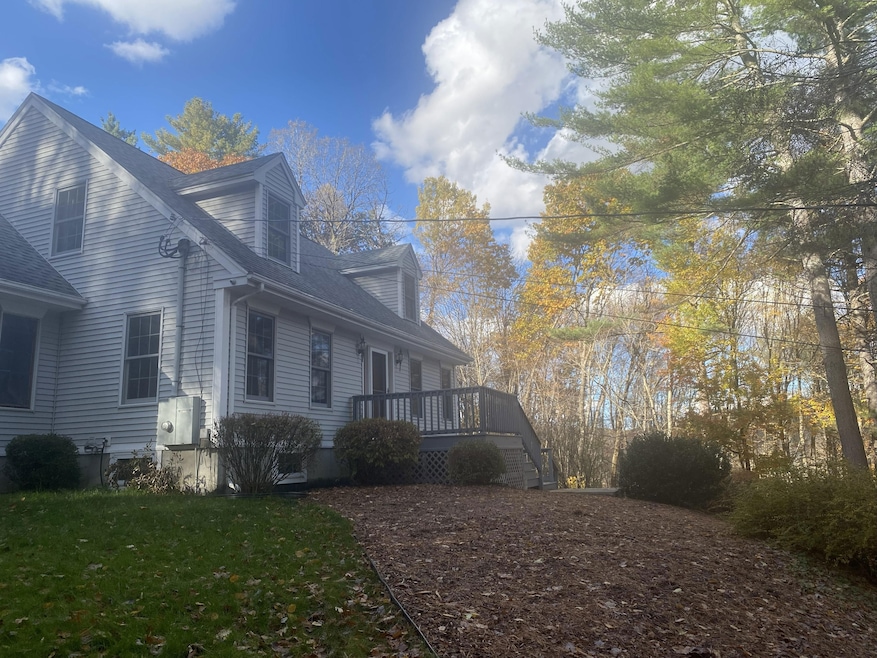
170 Bridge St Warren, MA 01083
Estimated payment $3,218/month
Total Views
2,854
3.65
Acres
$143,836
Price per Acre
158,994
Sq Ft Lot
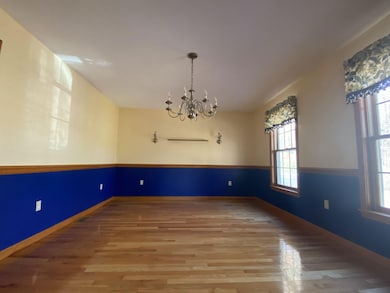
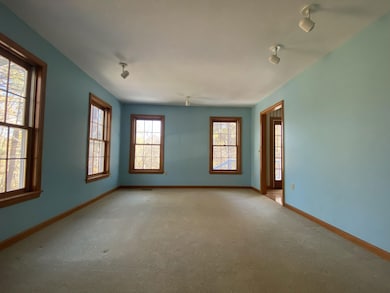
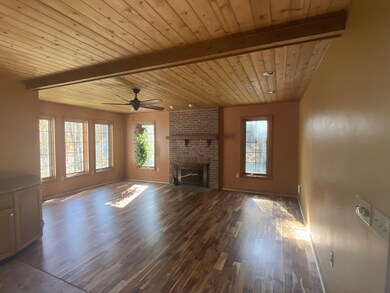
About This Lot
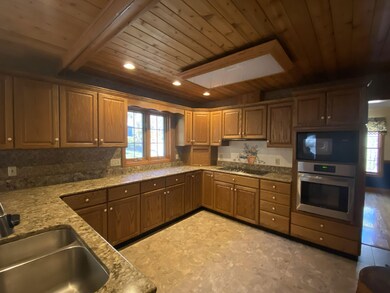
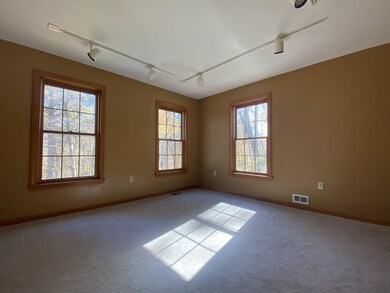
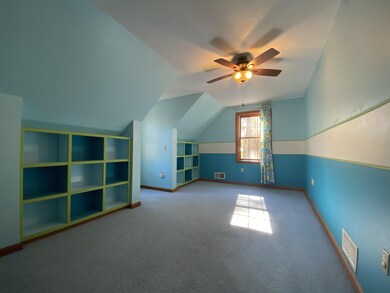
Open House Sun 11/2 11-1 Escape the hustle and bustle of work at this beautiful one owner home set privately on it's 3.65 acre lot. Having an open kitchen/living area catching up on the days events is easy while working in the cabinet packet kitchen. On the cooler evenings you can sit by the fireplace and be cozy and warm. First floor bedroom or office, game room in the lower level has kitchenette area. Basement has plumbing for another full bathroom, workshop area and one car garage. Seller had in-home business and zoning also allows for small livestock and there is land area for a barn and the 400 amp electrical service will help with any project.
Listing Provided By

Property Details
Property Type
- Land
Est. Annual Taxes
- $5,412
Lot Details
- Sloped Lot
- Current uses include residential single
- Potential uses include residential single
Utilities
- Well
Map
Create a Home Valuation Report for This Property
The Home Valuation Report is an in-depth analysis detailing your home's value as well as a comparison with similar homes in the area
Home Values in the Area
Average Home Value in this Area
Tax History
| Year | Tax Paid | Tax Assessment Tax Assessment Total Assessment is a certain percentage of the fair market value that is determined by local assessors to be the total taxable value of land and additions on the property. | Land | Improvement |
|---|---|---|---|---|
| 2025 | $5,412 | $365,400 | $60,200 | $305,200 |
| 2024 | $5,507 | $365,400 | $60,200 | $305,200 |
| 2023 | $5,344 | $338,200 | $60,200 | $278,000 |
| 2022 | $4,554 | $292,700 | $49,700 | $243,000 |
| 2021 | $5,487 | $279,300 | $47,000 | $232,300 |
| 2020 | $4,489 | $261,600 | $47,000 | $214,600 |
| 2019 | $4,483 | $247,000 | $47,000 | $200,000 |
| 2018 | $4,278 | $247,000 | $47,000 | $200,000 |
| 2017 | $4,187 | $225,600 | $48,600 | $177,000 |
| 2016 | $4,279 | $215,700 | $46,300 | $169,400 |
| 2015 | $3,844 | $205,000 | $46,300 | $158,700 |
| 2014 | $3,828 | $200,400 | $46,300 | $154,100 |
Source: Public Records
Property History
| Date | Event | Price | List to Sale | Price per Sq Ft |
|---|---|---|---|---|
| 10/22/2025 10/22/25 | For Sale | $525,000 | -- | $239 / Sq Ft |
Purchase History
| Date | Type | Sale Price | Title Company |
|---|---|---|---|
| Quit Claim Deed | -- | None Available |
Source: Public Records
Nearby Homes
- 44 Mill St
- 21 Hitchcock Ave
- 72 Maple St
- Lot 5 Brimfield Rd
- Lot 3 Brimfield Rd
- Lot 4 Reed St
- Lot 7 Reed St
- Lot 3 Reed St
- 82 Comins Pond Rd
- Lot 4 Brimfield Rd
- 35 Bacon St
- 17 Otis St
- 58 Nelson St
- Lot 8 Southbridge Rd
- LOT 7 Southbridge Rd
- 124 Southbridge Rd
- 152 Southbridge Rd Unit 3D
- 0 Town Farm Rd
- 57 East Rd
- 366 Southbridge Rd
- 85 E Main St Unit 3
- 12 Church St Unit 14
- 50 North St
- 77 W Main St Unit 77 West Main Street
- 1 Ware
- 20 Sherwin St Unit A
- 46 Madden Rd Unit 39
- 425 -431 Main St
- 425 -431 Main St
- 425-431 Main St Unit 429 Main St
- 379-385-385 Main St
- 384 Main St
- 1025 Central St Unit M
- 16 Saint John St
- 16 Saint John St
- 200 Brimfield Rd
- 1505 N Main St Unit 2nd floor
- 554 Main St Unit 1
- 548 Main St
- 548 Main St