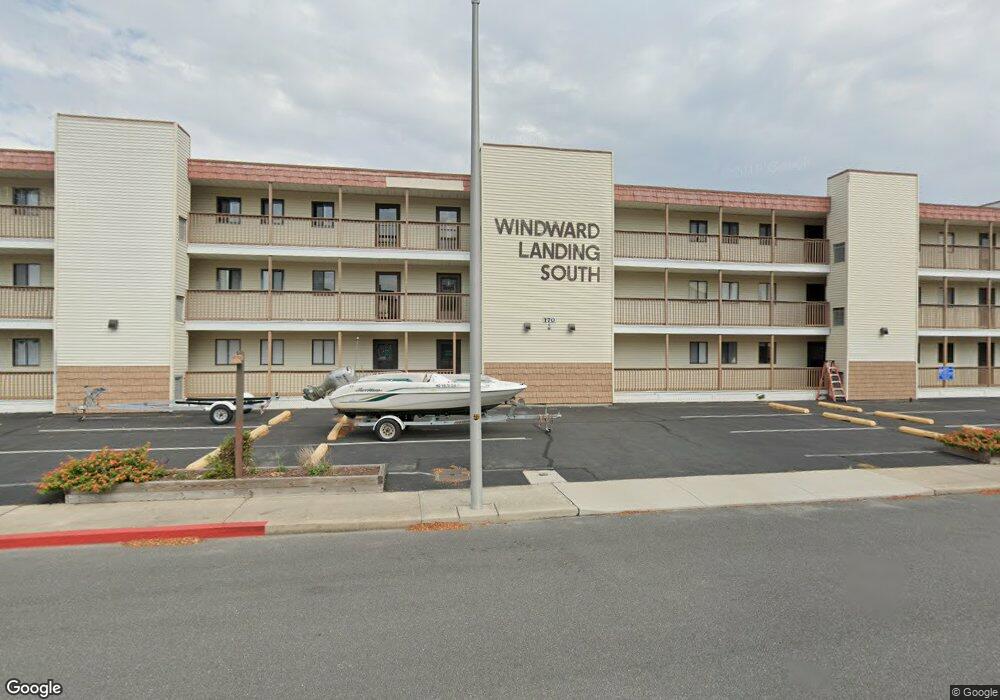
170 Captains Quarters Rd Unit 101 Ocean City, MD 21842
Estimated Value: $300,873 - $361,000
--
Bed
2
Baths
832
Sq Ft
$409/Sq Ft
Est. Value
About This Home
This home is located at 170 Captains Quarters Rd Unit 101, Ocean City, MD 21842 and is currently estimated at $340,218, approximately $408 per square foot. 170 Captains Quarters Rd Unit 101 is a home located in Worcester County with nearby schools including Ocean City Elementary School, Stephen Decatur Middle School, and Berlin Intermediate School.
Ownership History
Date
Name
Owned For
Owner Type
Purchase Details
Closed on
Nov 16, 2007
Sold by
Scott Mark J
Bought by
Sandra Bloch
Current Estimated Value
Home Financials for this Owner
Home Financials are based on the most recent Mortgage that was taken out on this home.
Original Mortgage
$183,950
Outstanding Balance
$116,567
Interest Rate
6.41%
Mortgage Type
Purchase Money Mortgage
Estimated Equity
$223,651
Purchase Details
Closed on
Nov 2, 2007
Sold by
Scott Mark J
Bought by
Sandra Bloch
Home Financials for this Owner
Home Financials are based on the most recent Mortgage that was taken out on this home.
Original Mortgage
$183,950
Outstanding Balance
$116,567
Interest Rate
6.41%
Mortgage Type
Purchase Money Mortgage
Estimated Equity
$223,651
Purchase Details
Closed on
Aug 9, 2005
Sold by
Connie Dirska
Bought by
Scott Mark J and Scott Lisa C
Home Financials for this Owner
Home Financials are based on the most recent Mortgage that was taken out on this home.
Original Mortgage
$203,500
Interest Rate
5.62%
Mortgage Type
New Conventional
Purchase Details
Closed on
Feb 3, 1981
Sold by
Hayden Hayden H and Hayden Bessie W
Bought by
Dirska Connie
Create a Home Valuation Report for This Property
The Home Valuation Report is an in-depth analysis detailing your home's value as well as a comparison with similar homes in the area
Home Values in the Area
Average Home Value in this Area
Purchase History
| Date | Buyer | Sale Price | Title Company |
|---|---|---|---|
| Sandra Bloch | $229,950 | -- | |
| Sandra Bloch | $229,950 | -- | |
| Scott Mark J | $254,484 | -- | |
| Dirska Connie | $31,500 | -- |
Source: Public Records
Mortgage History
| Date | Status | Borrower | Loan Amount |
|---|---|---|---|
| Open | Sandra Bloch | $183,950 | |
| Closed | Sandra Bloch | $183,950 | |
| Previous Owner | Scott Mark J | $203,500 |
Source: Public Records
Tax History Compared to Growth
Tax History
| Year | Tax Paid | Tax Assessment Tax Assessment Total Assessment is a certain percentage of the fair market value that is determined by local assessors to be the total taxable value of land and additions on the property. | Land | Improvement |
|---|---|---|---|---|
| 2025 | $3,095 | $273,100 | $0 | $0 |
| 2024 | $3,095 | $221,800 | $0 | $0 |
| 2023 | $2,396 | $170,500 | $85,200 | $85,300 |
| 2022 | $2,396 | $170,500 | $85,200 | $85,300 |
| 2021 | $2,409 | $170,500 | $85,200 | $85,300 |
| 2020 | $2,409 | $170,500 | $85,200 | $85,300 |
| 2019 | $2,351 | $165,233 | $0 | $0 |
| 2018 | $2,253 | $159,967 | $0 | $0 |
| 2017 | $2,185 | $154,700 | $0 | $0 |
| 2016 | -- | $154,700 | $0 | $0 |
| 2015 | $2,536 | $154,700 | $0 | $0 |
| 2014 | $2,536 | $170,500 | $0 | $0 |
Source: Public Records
Map
Nearby Homes
- 170 Captains Quarters Rd Unit 201
- 203 S Heron Dr Unit 104-D
- 160 Captains Quarters Rd
- 202 S Heron Dr Unit 101BP
- 161 Captains Quarters Rd Unit 103
- 301 S Heron Gull Ct
- 8 Newport Bay Dr Unit 8
- 202 N Heron Dr Unit 2025B
- 169 Jamestown Rd Unit 503
- 169 Jamestown Rd
- 169 Jamestown Rd
- 153 Captains Quarters Rd
- 201 S Heron Dr Unit B16
- 201 S Heron Dr Unit 5G
- 201 S Heron Dr
- 201 S Heron Dr Unit 3C
- 201 S Heron Dr Unit 11E
- 304 S Heron Gull Ct
- 11611 Shipwreck Rd Unit 1N HARBOR ONE NORTH
- 105 120th St Unit 37
- 170 Captains Quarters Rd Unit 3 E
- 170 Captains Quarters Rd Unit 104/1B
- 170 Captains Quarters Rd Unit 1B WINDWARD LANDING
- 170 Captains Quarters Rd Unit 304
- 170 Captains Quarters Rd Unit 103
- 170 Captains Quarters Rd Unit 204
- 170 Captains Quarters Rd Unit 104
- 170 Captains Quarters Rd Unit 105
- 170 Captains Quarters Rd Unit 102
- 170 Captains Quarters Rd Unit 202
- 170 Captains Quarters Rd Unit 205
- 170 Captains Quarters Rd Unit 303
- 170 Captains Quarters Rd Unit 305
- 170 Captains Quarters Rd Unit 302
- 170 Captains Quarters Rd Unit 203
- 170 Captains Quarters Rd Unit 201/2E
- 170 Captains Quarters Rd Unit 2B
- 170 Captains Quarters Rd Unit 301 ALSO KNOWN AS 3E
- 207 Windward Dr Unit 1D
- 207 Windward Dr Unit 1A