Estimated Value: $297,000 - $367,000
4
Beds
3
Baths
2,354
Sq Ft
$135/Sq Ft
Est. Value
About This Home
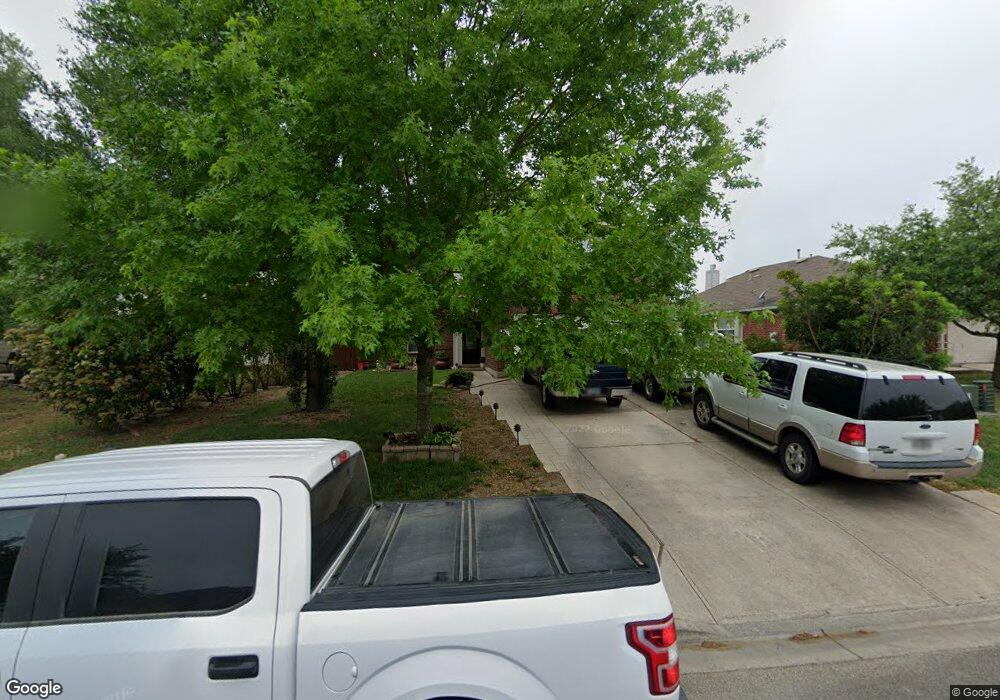
This home is located at 170 Carriage Way, Kyle, TX 78640 and is currently estimated at $318,777, approximately $135 per square foot. 170 Carriage Way is a home located in Hays County with nearby schools including Susie Fuentes Elementary School, Armando Chapa Middle School, and Lehman High School.
Ownership History
Date
Name
Owned For
Owner Type
Purchase Details
Closed on
Sep 19, 2007
Sold by
Hud
Bought by
Cantu Manuel M
Current Estimated Value
Home Financials for this Owner
Home Financials are based on the most recent Mortgage that was taken out on this home.
Original Mortgage
$130,000
Outstanding Balance
$82,560
Interest Rate
6.63%
Mortgage Type
Purchase Money Mortgage
Estimated Equity
$236,217
Purchase Details
Closed on
Nov 13, 2006
Sold by
Countrywide Home Loans Inc
Bought by
Hud
Purchase Details
Closed on
Nov 7, 2006
Sold by
Hendry Lyra M
Bought by
Cantu Manuel M
Purchase Details
Closed on
Jan 26, 2005
Sold by
Lennar Homes Of Texas Sales & Mktg Ltd
Bought by
Hendry Lyra M
Home Financials for this Owner
Home Financials are based on the most recent Mortgage that was taken out on this home.
Original Mortgage
$134,842
Interest Rate
5.71%
Mortgage Type
FHA
Create a Home Valuation Report for This Property
The Home Valuation Report is an in-depth analysis detailing your home's value as well as a comparison with similar homes in the area
Home Values in the Area
Average Home Value in this Area
Purchase History
| Date | Buyer | Sale Price | Title Company |
|---|---|---|---|
| Cantu Manuel M | -- | First American Title | |
| Hud | -- | None Available | |
| Cantu Manuel M | -- | -- | |
| Countrywide Home Loans Inc | $134,729 | None Available | |
| Hendry Lyra M | -- | North American Title | |
| Lennar Homes Of Texas Sales & Mktg Ltd | -- | North American Title |
Source: Public Records
Mortgage History
| Date | Status | Borrower | Loan Amount |
|---|---|---|---|
| Open | Cantu Manuel M | $130,000 | |
| Previous Owner | Hendry Lyra M | $134,842 |
Source: Public Records
Tax History Compared to Growth
Tax History
| Year | Tax Paid | Tax Assessment Tax Assessment Total Assessment is a certain percentage of the fair market value that is determined by local assessors to be the total taxable value of land and additions on the property. | Land | Improvement |
|---|---|---|---|---|
| 2025 | $5,939 | $333,280 | $66,550 | $266,730 |
| 2024 | $5,939 | $323,885 | $70,800 | $264,080 |
| 2023 | $6,578 | $294,441 | $84,960 | $304,090 |
| 2022 | $6,515 | $267,674 | $67,800 | $281,580 |
| 2021 | $6,457 | $243,340 | $43,400 | $199,940 |
| 2020 | $5,596 | $225,140 | $28,000 | $197,140 |
| 2019 | $5,984 | $216,620 | $28,000 | $188,620 |
| 2018 | $5,501 | $198,600 | $18,500 | $180,100 |
| 2017 | $5,168 | $183,310 | $18,500 | $164,810 |
| 2016 | $4,720 | $167,452 | $16,840 | $153,200 |
| 2015 | $3,592 | $152,229 | $16,840 | $145,080 |
Source: Public Records
Map
Nearby Homes
- 301 Zebra Dr
- 220 Masonwood Dr
- 241 Wild Buffalo Dr
- 221 Dashelle Run
- 430 Zebra Dr
- 201 Wild Buffalo Dr
- 180 Stephen Ct
- 189 Lexington
- 1113 N Old Highway 81
- 420 Emerald Fields Ln
- 25 Cortez St
- 950 Whispering Hollow Dr
- 100 Lexington
- 172 Winter St
- 481 Whispering Hollow Dr
- 111 Hiver Cir
- 102 Selvera St
- 1501 & 1503 N Burleson St
- 1503 N Burleson St
- 1501 N Burleson St
- 156 Carriage Way
- 186 Carriage Way
- 146 Carriage Way
- 200 Carriage Way
- 221 Bluestem St
- 215 Bluestem St
- 231 Bluestem St
- 181 Carriage Way
- 211 Bluestem St
- 136 Carriage Way
- 210 Carriage Way
- 191 Carriage Way
- 161 Carriage Way
- 171 Carriage Way
- 151 Carriage Way
- 241 Bluestem St
- 205 Bluestem St
- 201 Carriage Way
- 126 Carriage Way
- 220 Carriage Way