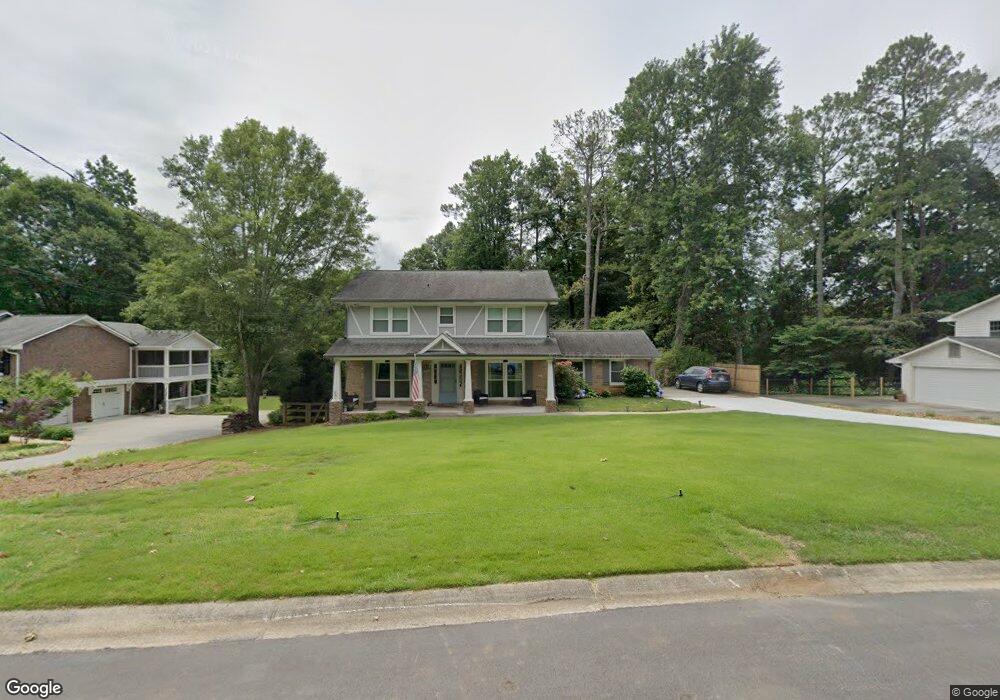
170 Corinth Ct Roswell, GA 30075
Estimated Value: $586,000 - $701,000
4
Beds
3
Baths
2,278
Sq Ft
$277/Sq Ft
Est. Value
About This Home
This home is located at 170 Corinth Ct, Roswell, GA 30075 and is currently estimated at $630,011, approximately $276 per square foot. 170 Corinth Ct is a home located in Fulton County with nearby schools including Roswell North Elementary School, Crabapple Middle School, and Roswell High School.
Ownership History
Date
Name
Owned For
Owner Type
Purchase Details
Closed on
Feb 14, 2020
Sold by
Cozonac Eugeniu
Bought by
Healy Cassidy C and Cote Ryan N
Current Estimated Value
Home Financials for this Owner
Home Financials are based on the most recent Mortgage that was taken out on this home.
Original Mortgage
$312,800
Outstanding Balance
$276,963
Interest Rate
3.6%
Mortgage Type
New Conventional
Estimated Equity
$353,049
Purchase Details
Closed on
Mar 13, 2013
Sold by
Lawrence Walter L
Bought by
Cozonac Eugeniu and Cozonac Kathryn
Home Financials for this Owner
Home Financials are based on the most recent Mortgage that was taken out on this home.
Original Mortgage
$189,440
Interest Rate
3.57%
Mortgage Type
VA
Purchase Details
Closed on
Jan 25, 1994
Sold by
Mason Jerald W
Bought by
Lawrence Walter L
Home Financials for this Owner
Home Financials are based on the most recent Mortgage that was taken out on this home.
Original Mortgage
$84,800
Interest Rate
3.87%
Create a Home Valuation Report for This Property
The Home Valuation Report is an in-depth analysis detailing your home's value as well as a comparison with similar homes in the area
Home Values in the Area
Average Home Value in this Area
Purchase History
| Date | Buyer | Sale Price | Title Company |
|---|---|---|---|
| Healy Cassidy C | $393,000 | -- | |
| Cozonac Eugeniu | $185,000 | -- | |
| Lawrence Walter L | $106,000 | -- |
Source: Public Records
Mortgage History
| Date | Status | Borrower | Loan Amount |
|---|---|---|---|
| Open | Healy Cassidy C | $312,800 | |
| Closed | Healy Cassidy C | $38,709 | |
| Previous Owner | Cozonac Eugeniu | $189,440 | |
| Previous Owner | Lawrence Walter L | $84,800 |
Source: Public Records
Tax History Compared to Growth
Tax History
| Year | Tax Paid | Tax Assessment Tax Assessment Total Assessment is a certain percentage of the fair market value that is determined by local assessors to be the total taxable value of land and additions on the property. | Land | Improvement |
|---|---|---|---|---|
| 2025 | $1,001 | $186,760 | $64,800 | $121,960 |
| 2023 | $5,653 | $200,280 | $44,640 | $155,640 |
| 2022 | $3,587 | $136,320 | $24,680 | $111,640 |
| 2021 | $4,215 | $132,360 | $23,960 | $108,400 |
| 2020 | $2,293 | $123,880 | $23,160 | $100,720 |
| 2019 | $335 | $109,560 | $18,680 | $90,880 |
| 2018 | $3,019 | $106,960 | $18,240 | $88,720 |
| 2017 | $1,881 | $64,480 | $15,080 | $49,400 |
| 2016 | $1,833 | $62,800 | $15,080 | $47,720 |
| 2015 | $2,165 | $62,280 | $15,080 | $47,200 |
| 2014 | $1,909 | $62,280 | $15,080 | $47,200 |
Source: Public Records
Map
Nearby Homes
- 180 Corinth Ct
- 160 Corinth Ct
- 180 Moonshadow Ct
- 190 Moonshadow Ct
- 170 Moonshadow Ct
- 190 Corinth Ct
- 200 Moonshadow Ct Unit 1
- 175 Corinth Ct
- 150 Corinth Ct
- 165 Corinth Ct
- 185 Corinth Ct
- 160 Moonshadow Ct
- 210 Moonshadow Ct Unit 1
- 200 Corinth Ct
- 145 Corinth Ct
- 0 Moonshadow Ct Unit 8305261
- 0 Moonshadow Ct Unit 8704615
- 0 Moonshadow Ct Unit 8489112
- 0 Moonshadow Ct Unit 8753389
- 0 Moonshadow Ct Unit 8418432