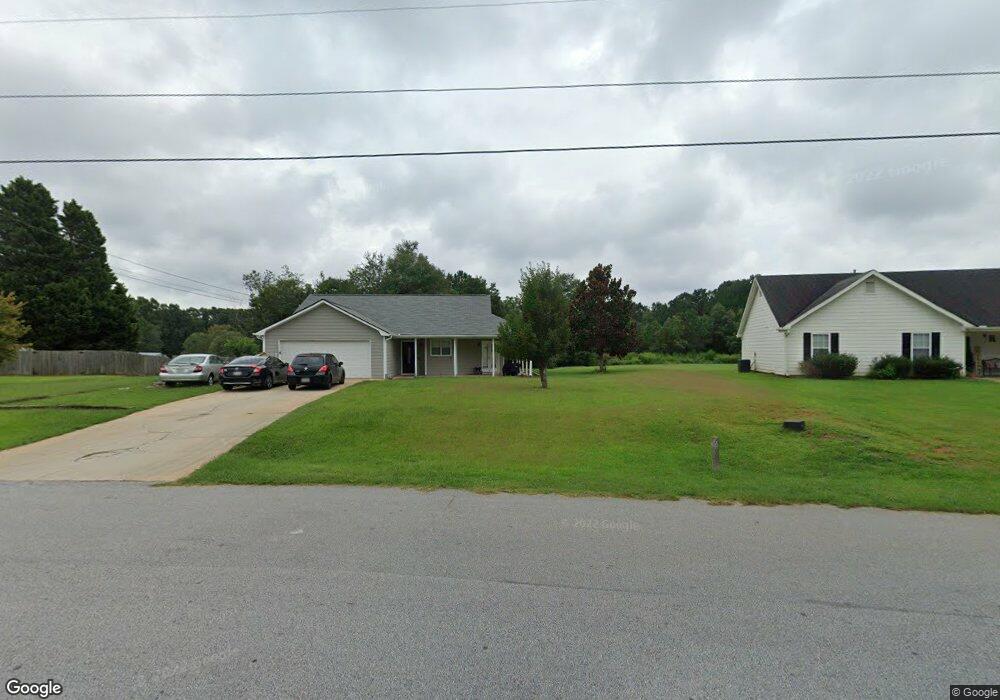
170 Falcon Ridge Dr Covington, GA 30016
Estimated Value: $247,000 - $266,000
--
Bed
2
Baths
1,207
Sq Ft
$213/Sq Ft
Est. Value
About This Home
This home is located at 170 Falcon Ridge Dr, Covington, GA 30016 and is currently estimated at $257,048, approximately $212 per square foot. 170 Falcon Ridge Dr is a home located in Newton County with nearby schools including South Salem Elementary School, Liberty Middle School, and Alcovy High School.
Ownership History
Date
Name
Owned For
Owner Type
Purchase Details
Closed on
May 25, 2021
Sold by
Opendoor Property Trust I
Bought by
Fkh Sfr Propco D Lp
Current Estimated Value
Purchase Details
Closed on
Mar 23, 2021
Sold by
Hunter Leasa
Bought by
Opendoor Property Trust I
Purchase Details
Closed on
Feb 26, 2019
Sold by
Mayo Joseph D
Bought by
Hunter Eric and Hunter Leasa
Home Financials for this Owner
Home Financials are based on the most recent Mortgage that was taken out on this home.
Original Mortgage
$134,518
Interest Rate
5.5%
Mortgage Type
FHA
Purchase Details
Closed on
Dec 27, 1996
Sold by
Pulaski Mc
Bought by
Mayo Joseph and Holcombe Amy
Purchase Details
Closed on
Apr 13, 1994
Sold by
Thompson Res Bldrs
Bought by
Payne Timothy and Lee Ken Susan
Home Financials for this Owner
Home Financials are based on the most recent Mortgage that was taken out on this home.
Original Mortgage
$74,550
Interest Rate
7.47%
Create a Home Valuation Report for This Property
The Home Valuation Report is an in-depth analysis detailing your home's value as well as a comparison with similar homes in the area
Home Values in the Area
Average Home Value in this Area
Purchase History
| Date | Buyer | Sale Price | Title Company |
|---|---|---|---|
| Fkh Sfr Propco D Lp | $198,200 | -- | |
| Opendoor Property Trust I | $179,600 | -- | |
| Hunter Eric | $137,000 | -- | |
| Mayo Joseph | $74,500 | -- | |
| Payne Timothy | $73,900 | -- |
Source: Public Records
Mortgage History
| Date | Status | Borrower | Loan Amount |
|---|---|---|---|
| Previous Owner | Hunter Eric | $134,518 | |
| Previous Owner | Payne Timothy | $74,550 | |
| Closed | Mayo Joseph | $0 |
Source: Public Records
Tax History Compared to Growth
Tax History
| Year | Tax Paid | Tax Assessment Tax Assessment Total Assessment is a certain percentage of the fair market value that is determined by local assessors to be the total taxable value of land and additions on the property. | Land | Improvement |
|---|---|---|---|---|
| 2024 | $2,291 | $90,440 | $14,000 | $76,440 |
| 2023 | $2,445 | $90,120 | $6,000 | $84,120 |
| 2022 | $1,949 | $73,240 | $6,000 | $67,240 |
| 2021 | $1,633 | $57,720 | $6,000 | $51,720 |
| 2020 | $1,556 | $50,200 | $6,000 | $44,200 |
| 2019 | $1,465 | $46,840 | $6,000 | $40,840 |
| 2018 | $1,153 | $37,480 | $6,000 | $31,480 |
| 2017 | $1,054 | $34,600 | $6,000 | $28,600 |
| 2016 | $895 | $29,960 | $3,800 | $26,160 |
| 2015 | $814 | $27,600 | $3,200 | $24,400 |
| 2014 | $570 | $20,520 | $0 | $0 |
Source: Public Records
Map
Nearby Homes
- 40 Freebia Walk
- 415 Rosser Rd
- 40 Lakeside Trail
- 145 Whispering Pine Dr
- 930 Smith Store Rd
- 417 Rosser Rd
- 30 Oak Wood Ln
- 115 Branchwood Dr
- 560 Clearbrook Dr
- 800 Mills Dr
- 350 Glynnshire Ct Unit 2
- 7 Glynnshire Ct
- 70 Countryside Ln
- 310 Glynnshire Ct
- 115 Cross Creek Dr
- 50 Freedom Ct
- 165 Tulip Dr
- 205 Tulip Dr
- 25 Woodcrest Dr
- 261 Tulip Dr
- 170 Falcon Ridge Dr
- 160 Falcon Ridge Dr Unit 1
- 180 Falcon Ridge Dr
- 150 Falcon Ridge Dr
- 155 Falcon Ridge Dr
- 185 Falcon Ridge Dr Unit 1
- 190 Falcon Ridge Dr
- 145 Falcon Ridge Dr Unit 1
- 140 Falcon Ridge Dr Unit 1
- 650 Smith Store Rd
- 35 Falcon Crest Dr
- 195 Falcon Ridge Dr Unit UN 1
- 195 Falcon Ridge Dr
- 130 Falcon Ridge Dr Unit 1
- 135 Falcon Ridge Dr
- 200 Falcon Ridge Dr Unit 1
- 125 Falcon Ridge Dr Unit 1
- 120 Falcon Ridge Dr Unit 1
- 15 Sable Cir Unit 1
- 15 Sable Cir Unit 3