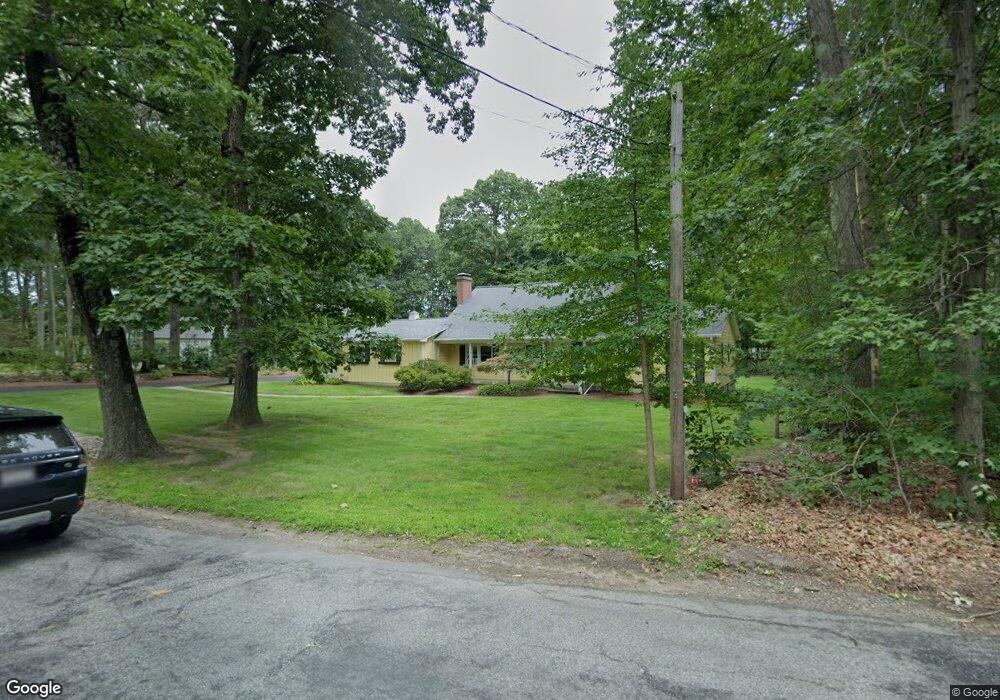
170 Floral St Shrewsbury, MA 01545
Estimated Value: $689,000 - $779,000
2
Beds
3
Baths
1,774
Sq Ft
$410/Sq Ft
Est. Value
About This Home
This home is located at 170 Floral St, Shrewsbury, MA 01545 and is currently estimated at $727,589, approximately $410 per square foot. 170 Floral St is a home located in Worcester County with nearby schools including Floral Street School, Sherwood Middle School, and Oak Middle School.
Ownership History
Date
Name
Owned For
Owner Type
Purchase Details
Closed on
Feb 22, 2019
Sold by
Leming James C
Bought by
James Charles Leming Ret and Leming
Current Estimated Value
Purchase Details
Closed on
Dec 15, 2016
Sold by
Cavanaugh Mary
Bought by
Leming James C
Purchase Details
Closed on
Jul 23, 2004
Sold by
Astrella Carolyn M and Astrella
Bought by
Cavanaugh Mary
Create a Home Valuation Report for This Property
The Home Valuation Report is an in-depth analysis detailing your home's value as well as a comparison with similar homes in the area
Home Values in the Area
Average Home Value in this Area
Purchase History
| Date | Buyer | Sale Price | Title Company |
|---|---|---|---|
| James Charles Leming Ret | -- | -- | |
| James Charles Leming Ret | -- | -- | |
| James Charles Leming Ret | -- | -- | |
| Leming James C | $360,000 | -- | |
| Cavanaugh Mary | $380,000 | -- | |
| Cavanaugh Mary | $380,000 | -- | |
| Cavanaugh Mary | $380,000 | -- | |
| Cavanaugh Mary | -- | -- | |
| Cavanaugh Mary | -- | -- |
Source: Public Records
Tax History Compared to Growth
Tax History
| Year | Tax Paid | Tax Assessment Tax Assessment Total Assessment is a certain percentage of the fair market value that is determined by local assessors to be the total taxable value of land and additions on the property. | Land | Improvement |
|---|---|---|---|---|
| 2025 | $81 | $673,200 | $311,600 | $361,600 |
| 2024 | $7,599 | $613,800 | $296,600 | $317,200 |
| 2023 | $7,345 | $559,800 | $296,600 | $263,200 |
| 2022 | $8,009 | $567,600 | $296,600 | $271,000 |
| 2021 | $6,271 | $475,400 | $237,300 | $238,100 |
| 2020 | $5,928 | $475,400 | $237,300 | $238,100 |
| 2019 | $5,501 | $437,600 | $224,100 | $213,500 |
| 2018 | $5,343 | $422,000 | $215,000 | $207,000 |
| 2017 | $4,966 | $387,100 | $184,500 | $202,600 |
| 2016 | $5,287 | $406,700 | $183,400 | $223,300 |
| 2015 | $5,328 | $403,600 | $168,400 | $235,200 |
Source: Public Records
Map
Nearby Homes
- 65 Commons Dr Unit 502
- 65 Commons Dr Unit 410
- 85 Commons Dr Unit 210
- 39 Harvard Ave
- 24 Brook St
- 3 Brookdale Cir
- 562 South St
- 39 Old Brook Rd
- 22 Hitching Post Ln
- 4 Horseneck Rd
- 10 Falcon Dr
- 603 South St
- 11 Hillside Rd
- 457 Walnut St
- 18 Eastwood Rd
- 28 Cherry St
- Lot 3 Cherry St
- Lot 2 Cherry St
- 114 Grafton St
- 9 Arnold Rd