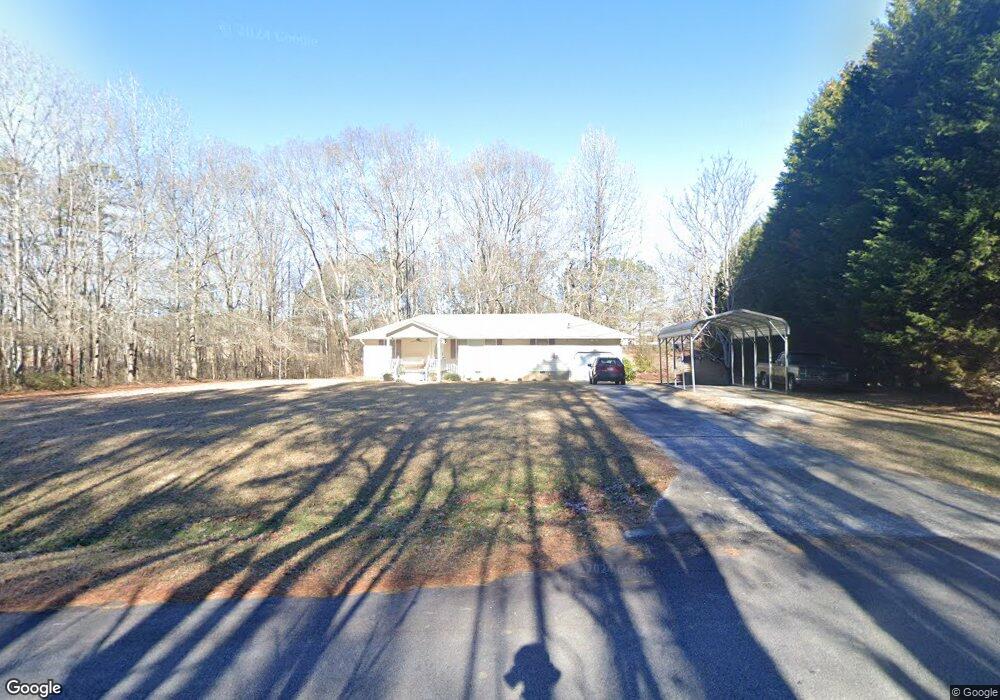
170 Hannah Rd Temple, GA 30179
Estimated Value: $233,227 - $275,000
3
Beds
2
Baths
1,200
Sq Ft
$211/Sq Ft
Est. Value
About This Home
This home is located at 170 Hannah Rd, Temple, GA 30179 and is currently estimated at $253,557, approximately $211 per square foot. 170 Hannah Rd is a home located in Paulding County with nearby schools including Union Elementary School, Carl Scoggins Sr. Middle School, and South Paulding High School.
Ownership History
Date
Name
Owned For
Owner Type
Purchase Details
Closed on
Oct 8, 2015
Sold by
Wigenton Judy W
Bought by
Wigenton Judy W and Wigenton Leonard Frank
Current Estimated Value
Purchase Details
Closed on
Jun 18, 2004
Sold by
Dollar David S
Bought by
Wigenton Judy W
Home Financials for this Owner
Home Financials are based on the most recent Mortgage that was taken out on this home.
Original Mortgage
$75,000
Interest Rate
6.3%
Mortgage Type
New Conventional
Purchase Details
Closed on
Mar 20, 2002
Sold by
Yancy Terry
Bought by
Dollar David S
Home Financials for this Owner
Home Financials are based on the most recent Mortgage that was taken out on this home.
Original Mortgage
$60,000
Interest Rate
10%
Mortgage Type
New Conventional
Purchase Details
Closed on
Jan 7, 2002
Sold by
Armstrong Sandra W
Purchase Details
Closed on
Aug 28, 2001
Sold by
Boatman Jean
Purchase Details
Closed on
Sep 7, 1999
Sold by
Boatman Jean
Purchase Details
Closed on
Jul 9, 1999
Sold by
Swimmey Dianne
Purchase Details
Closed on
Jul 29, 1997
Sold by
Boatman Jean
Create a Home Valuation Report for This Property
The Home Valuation Report is an in-depth analysis detailing your home's value as well as a comparison with similar homes in the area
Home Values in the Area
Average Home Value in this Area
Purchase History
| Date | Buyer | Sale Price | Title Company |
|---|---|---|---|
| Wigenton Judy W | -- | -- | |
| Wigenton Judy W | $75,000 | -- | |
| Dollar David S | $75,000 | -- | |
| -- | $75,000 | -- | |
| -- | -- | -- | |
| -- | $60,000 | -- | |
| -- | -- | -- | |
| -- | -- | -- | |
| -- | -- | -- |
Source: Public Records
Mortgage History
| Date | Status | Borrower | Loan Amount |
|---|---|---|---|
| Previous Owner | Wigenton Judy W | $75,000 | |
| Previous Owner | -- | $60,000 |
Source: Public Records
Tax History
| Year | Tax Paid | Tax Assessment Tax Assessment Total Assessment is a certain percentage of the fair market value that is determined by local assessors to be the total taxable value of land and additions on the property. | Land | Improvement |
|---|---|---|---|---|
| 2025 | $527 | $81,972 | $12,600 | $69,372 |
| 2024 | $538 | $83,296 | $13,240 | $70,056 |
| 2023 | $617 | $80,172 | $12,600 | $67,572 |
| 2022 | $552 | $70,384 | $12,440 | $57,944 |
| 2021 | $535 | $55,904 | $8,880 | $47,024 |
| 2020 | $929 | $52,472 | $7,640 | $44,832 |
| 2019 | $833 | $46,824 | $6,600 | $40,224 |
| 2018 | $583 | $34,912 | $6,400 | $28,512 |
| 2017 | $541 | $32,312 | $6,400 | $25,912 |
| 2016 | $429 | $27,368 | $6,880 | $20,488 |
| 2015 | $735 | $25,744 | $6,880 | $18,864 |
| 2014 | $819 | $27,792 | $5,880 | $21,912 |
| 2013 | -- | $21,800 | $5,880 | $15,920 |
Source: Public Records
Map
Nearby Homes
- 265 Honeysuckle Ln
- 689 Hardin Rd
- 221 Pleasant Way
- 250 Carter Creek Dr
- 391 Mulberry Rock Rd
- 718 Baskin Rd
- 10331 Buchanan Hwy
- 510 Orchard Dr
- 104 Federal Path
- 128 Tanner Dr
- 0 Rustin Dr Unit 10617842
- 0 Rustin Dr Unit 7657021
- 170 Baskin Rd
- 11070 Buchanan Hwy
- 723 Mulberry Rock Rd
- 703 Mulberry Rock Rd
- 177 Rustin Dr
- 42 Bryan Miller Rd
- 59 Mullberry Path
- 8713 Buchanan Hwy
- 138 Hannah Rd
- 92 Hannah Rd
- 135 Honeysuckle Ln
- 117 Hannah Rd
- 93 Honeysuckle Ln
- 157 Honeysuckle Ln
- 1006 Highway 101 S
- 50 Hannah Rd
- 314 Hannah Rd
- UNASSIGNED Honeysuckle Ln
- 62 Honeysuckle Ln
- 0 Honeysuckle Ln
- 00 Honeysuckle Ln
- 0 Honeysuckle Ln Unit 10061302
- 0 Honeysuckle Ln Unit 10087151
- 0 Honeysuckle Ln Unit 10120315
- 0 Honeysuckle Ln Unit 4 10356835
- 0 Honeysuckle Ln Unit 7434968
- 0 Honeysuckle Ln Unit 4 10351397
- 0 Honeysuckle Ln Unit 7432112