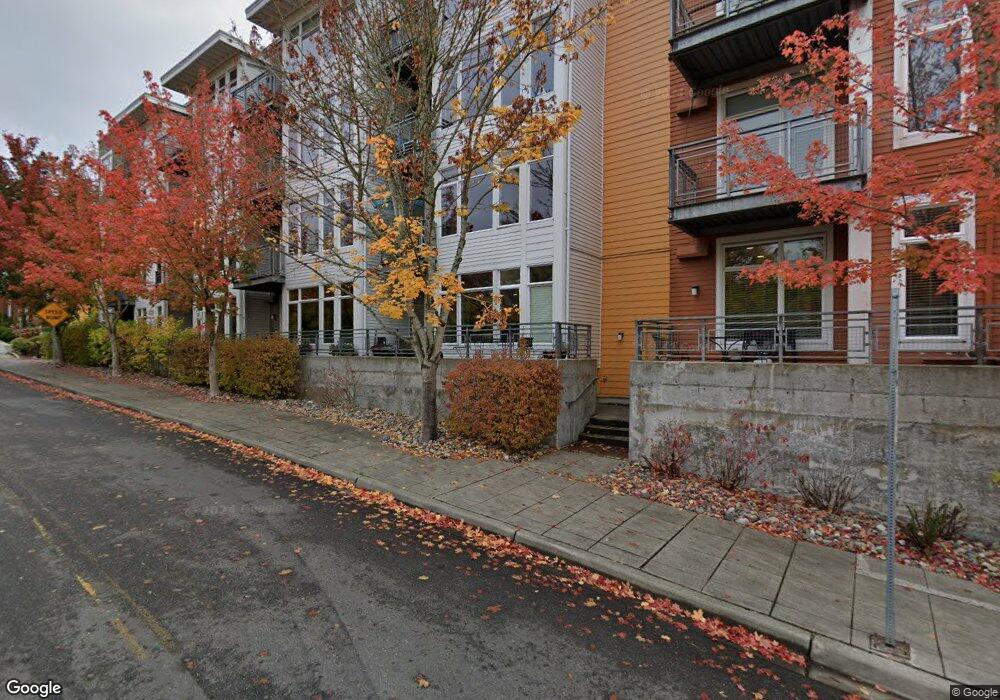
170 Harbor Square Loop NE Unit A402 Bainbridge Island, WA 98110
Estimated Value: $1,336,000 - $2,347,000
3
Beds
3
Baths
1,935
Sq Ft
$865/Sq Ft
Est. Value
About This Home
This home is located at 170 Harbor Square Loop NE Unit A402, Bainbridge Island, WA 98110 and is currently estimated at $1,673,078, approximately $864 per square foot. 170 Harbor Square Loop NE Unit A402 is a home located in Kitsap County with nearby schools including Bainbridge High School, Madrona School, and St. Cecilia Catholic School.
Ownership History
Date
Name
Owned For
Owner Type
Purchase Details
Closed on
Aug 24, 2016
Sold by
Bernstein Gary A and Bernstein Marianne
Bought by
Bernstein Gary
Current Estimated Value
Purchase Details
Closed on
Aug 17, 2016
Sold by
Bernstein Gary A
Bought by
Bernstein Gary A
Purchase Details
Closed on
Apr 8, 2009
Sold by
Bernstein Gary A and Bernstein Marianne
Bought by
Bernstein Gary A and Bernstein Marianne
Purchase Details
Closed on
Aug 14, 2006
Sold by
Opus Nwr Development Llc
Bought by
Bernstein Gary A and Bernstein Marianne
Home Financials for this Owner
Home Financials are based on the most recent Mortgage that was taken out on this home.
Original Mortgage
$596,250
Interest Rate
5.5%
Mortgage Type
Purchase Money Mortgage
Create a Home Valuation Report for This Property
The Home Valuation Report is an in-depth analysis detailing your home's value as well as a comparison with similar homes in the area
Home Values in the Area
Average Home Value in this Area
Purchase History
| Date | Buyer | Sale Price | Title Company |
|---|---|---|---|
| Bernstein Gary | $654 | Attorney | |
| Bernstein Gary A | $654 | Attorney | |
| Bodnar Andrew N | $1,230,059 | Attorney | |
| Bernstein Gary A | -- | None Available | |
| Bernstein Gary A | $795,280 | Transnation Title |
Source: Public Records
Mortgage History
| Date | Status | Borrower | Loan Amount |
|---|---|---|---|
| Previous Owner | Bernstein Gary A | $596,250 |
Source: Public Records
Tax History Compared to Growth
Tax History
| Year | Tax Paid | Tax Assessment Tax Assessment Total Assessment is a certain percentage of the fair market value that is determined by local assessors to be the total taxable value of land and additions on the property. | Land | Improvement |
|---|---|---|---|---|
| 2026 | $11,037 | $1,369,960 | -- | $1,369,960 |
| 2025 | $11,037 | $1,369,960 | -- | $1,369,960 |
| 2024 | $10,056 | $1,242,590 | -- | $1,242,590 |
| 2023 | $10,008 | $1,242,590 | $0 | $1,242,590 |
| 2022 | $10,652 | $1,129,630 | $0 | $1,129,630 |
| 2021 | $10,636 | $1,075,840 | $0 | $1,075,840 |
| 2020 | $10,523 | $1,049,600 | $0 | $1,049,600 |
| 2019 | $9,830 | $999,620 | $0 | $999,620 |
| 2018 | $10,474 | $696,600 | $0 | $696,600 |
| 2017 | $7,252 | $696,600 | $0 | $696,600 |
| 2016 | $7,632 | $697,430 | $0 | $697,430 |
| 2015 | $6,521 | $606,460 | $0 | $606,460 |
| 2014 | -- | $527,360 | $0 | $527,360 |
| 2013 | -- | $527,360 | $0 | $527,360 |
Source: Public Records
Map
Nearby Homes
- 465 Winslow Way E Unit 108
- 522 Madrona Way NE Unit 4
- 610 NE Vineyard Ln Unit A104
- 752 NE Vineyard Ln Unit L205
- 620 NE Vineyard Ln Unit B302
- 259 Shepard Way NW Unit 204
- 141 Parfitt Way SW Unit A-35
- 141 Parfitt Way SW Unit M-10
- 200 Shepard Way NW
- 204 Shepard Way NW
- 224 Canopy Path NW
- 144 Hall Brothers Loop NW Unit 101
- 214 Shepard Way NW
- 230 Canopy Path NW
- 392 Wills Ln NW
- 774 Madison Ave N Unit B774
- 171 Wallace Way NE Unit B
- 9986 NE Ewing St
- 1322 Polly's Ln
- 1245 High School Rd NE
- 170 Harbor Square Loop NE Unit A212
- 170 Harbor Square Loop NE Unit A404
- 170 Harbor Square Loop NE Unit A408
- 170 Harbor Square Loop NE Unit P-28
- 170 Harbor Square Loop NE Unit P-14
- 170 Harbor Square Loop NE Unit A211
- 170 Harbor Square Loop NE
- 170 Harbor Square Loop NE Unit P-43
- 170 Harbor Square Loop NE Unit A-307
- 170 Harbor Square Loop NE Unit A203
- 170 Harbor Square Loop NE Unit A-101
- 170 Harbor Square Loop NE Unit P 32
- 170 Harbor Square Loop NE Unit P 12
- 170 Harbor Square Loop NE Unit 406
- 170 Harbor Square Loop NE Unit B 417
- 170 Harbor Square Loop NE Unit P 29
- 170 Harbor Square Loop NE Unit A-412
- 170 Harbor Square Loop NE Unit 208
- 170 Harbor Square Loop NE Unit A411
- 170 Harbor Square Loop NE Unit A108