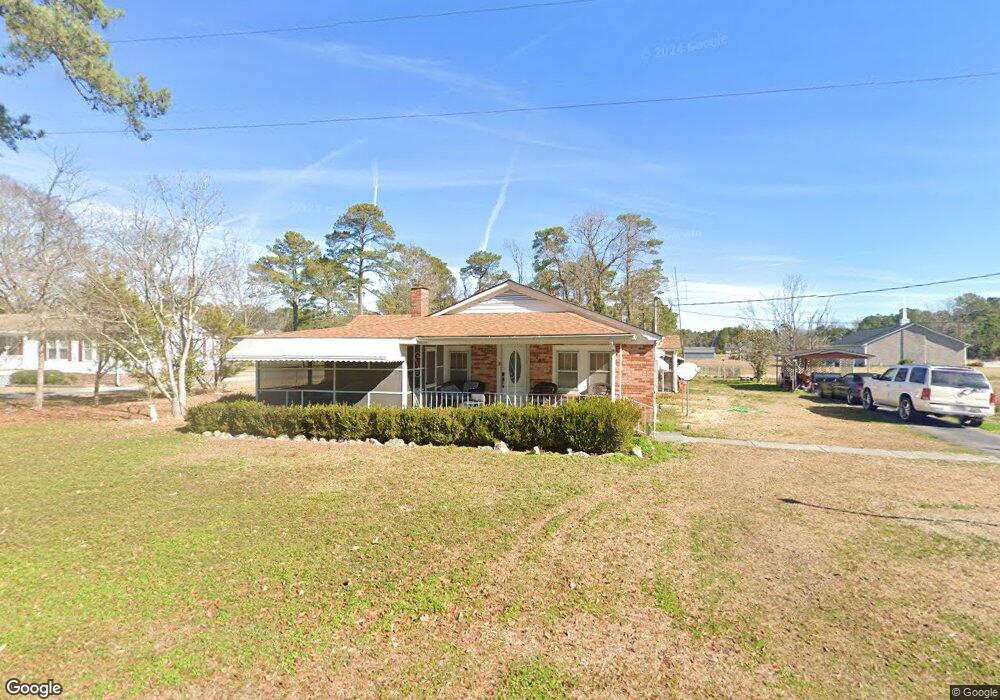
170 Huffmantown Rd Richlands, NC 28574
Estimated Value: $198,384 - $288,000
3
Beds
1
Bath
1,529
Sq Ft
$155/Sq Ft
Est. Value
About This Home
This home is located at 170 Huffmantown Rd, Richlands, NC 28574 and is currently estimated at $236,846, approximately $154 per square foot. 170 Huffmantown Rd is a home located in Onslow County with nearby schools including Richlands Elementary School, Trexler Middle School, and Richlands High School.
Ownership History
Date
Name
Owned For
Owner Type
Purchase Details
Closed on
Aug 13, 2025
Sold by
Murphy Anthony P
Bought by
Murphy Anthony P and Henry Ariana S
Current Estimated Value
Home Financials for this Owner
Home Financials are based on the most recent Mortgage that was taken out on this home.
Original Mortgage
$175,010
Outstanding Balance
$174,857
Interest Rate
6.67%
Mortgage Type
FHA
Estimated Equity
$61,989
Purchase Details
Closed on
Oct 6, 2021
Sold by
Parady Bobbie and Mendoza Jose Angel
Bought by
Murphy Anthony P
Purchase Details
Closed on
Jun 29, 2006
Sold by
Horne A B and Horne Kenneth E
Bought by
Murphy Anthony P and Murphy Bobbie L Parady
Home Financials for this Owner
Home Financials are based on the most recent Mortgage that was taken out on this home.
Original Mortgage
$101,600
Interest Rate
7.6%
Mortgage Type
Purchase Money Mortgage
Create a Home Valuation Report for This Property
The Home Valuation Report is an in-depth analysis detailing your home's value as well as a comparison with similar homes in the area
Home Values in the Area
Average Home Value in this Area
Purchase History
| Date | Buyer | Sale Price | Title Company |
|---|---|---|---|
| Murphy Anthony P | -- | None Listed On Document | |
| Murphy Anthony P | -- | None Listed On Document | |
| Murphy Anthony P | -- | None Available | |
| Murphy Anthony P | $127,000 | Chicago Title Insurance Co |
Source: Public Records
Mortgage History
| Date | Status | Borrower | Loan Amount |
|---|---|---|---|
| Open | Murphy Anthony P | $175,010 | |
| Closed | Murphy Anthony P | $175,010 | |
| Previous Owner | Murphy Anthony P | $101,600 |
Source: Public Records
Tax History Compared to Growth
Tax History
| Year | Tax Paid | Tax Assessment Tax Assessment Total Assessment is a certain percentage of the fair market value that is determined by local assessors to be the total taxable value of land and additions on the property. | Land | Improvement |
|---|---|---|---|---|
| 2025 | $581 | $88,733 | $26,530 | $62,203 |
| 2024 | $581 | $88,733 | $26,530 | $62,203 |
| 2023 | $581 | $88,733 | $26,530 | $62,203 |
| 2022 | $581 | $88,733 | $26,530 | $62,203 |
| 2021 | $474 | $67,270 | $19,460 | $47,810 |
| 2020 | $474 | $67,270 | $19,460 | $47,810 |
| 2019 | $474 | $67,270 | $19,460 | $47,810 |
| 2018 | $474 | $67,270 | $19,460 | $47,810 |
| 2017 | $452 | $67,010 | $19,460 | $47,550 |
| 2016 | $452 | $67,010 | $0 | $0 |
| 2015 | $452 | $67,010 | $0 | $0 |
| 2014 | $452 | $67,010 | $0 | $0 |
Source: Public Records
Map
Nearby Homes
- 149 Huffmantown Rd
- 978 Kinston Hwy
- 722 Greenwich Place
- 745 Greenwich Place
- 601 Central Park Way
- 749 Greenwich Place
- Plan 1522 at Waverly Place
- Plan 1830 at Waverly Place
- Plan 2604 at Waverly Place
- Plan 1727 at Waverly Place
- Plan 1634 at Waverly Place
- 751 Greenwich Place
- Plan 1434 at Waverly Place
- Plan 3105 at Waverly Place
- 304 W Foy St
- 203 W Foy St
- 132 Brookhaven Dr
- 424 Huffmantown Rd
- 107 New St
- 444 Huffmantown
- 176 Huffmantown Rd
- 167 Huffmantown Rd
- 173 Huffmantown Rd
- Off Sr 130 Huffmantown Rd
- 180 Huffmantown Rd
- 104 Ervintown Rd
- 177 Huffmantown Rd
- 181 Huffmantown Rd
- 108 Ervintown Rd
- 101 Ervintown Rd
- 186 Huffmantown Rd
- 183 Huffmantown Rd
- 156 Huffmantown Rd
- 112 Ervintown Rd
- 182 Huffmantown Rd
- 109 Ervintown Rd
- 188 Huffmantown Rd
- 155 Huffmantown Rd
- 114 Ervintown Rd
- 230 Kinston Hwy