Estimated Value: $221,000 - $317,407
3
Beds
3
Baths
2,588
Sq Ft
$103/Sq Ft
Est. Value
About This Home
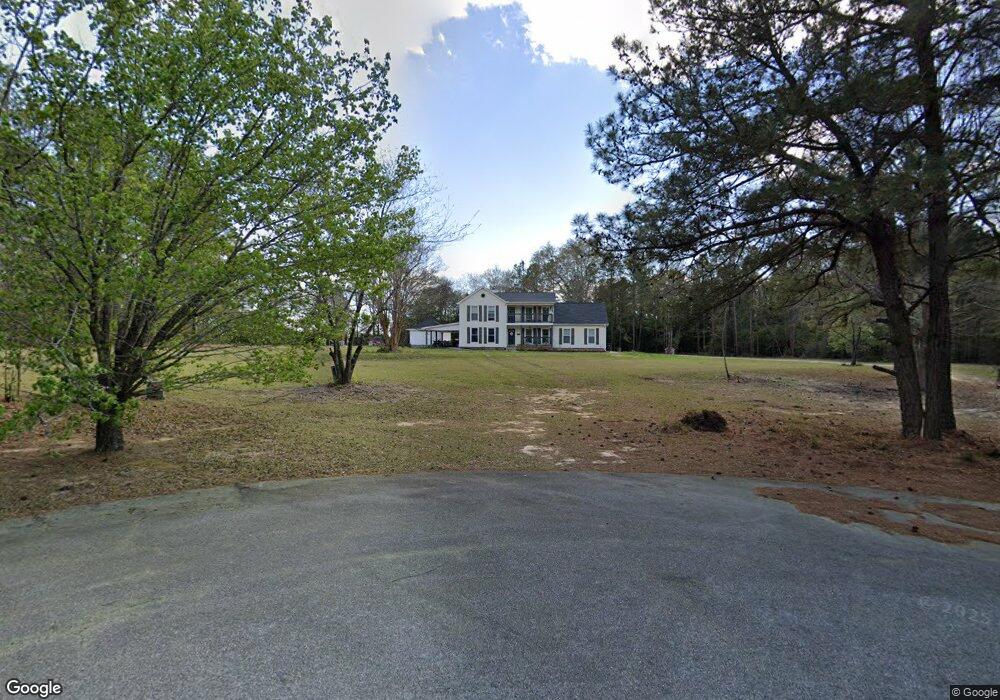
This home is located at 170 Jay Ct, Byron, GA 31008 and is currently estimated at $266,852, approximately $103 per square foot. 170 Jay Ct is a home located in Peach County with nearby schools including Byron Elementary School, Byron Middle School, and Peach County High School.
Ownership History
Date
Name
Owned For
Owner Type
Purchase Details
Closed on
Apr 18, 2024
Sold by
Bluse James H
Bought by
Velasco Samantha
Current Estimated Value
Purchase Details
Closed on
Sep 26, 2012
Sold by
Meck Deborah
Bought by
Bluse James H
Purchase Details
Closed on
Sep 10, 2012
Sold by
Bluse Steve
Bought by
Bluse James H
Purchase Details
Closed on
Jul 6, 2009
Sold by
Bennett Kim
Bought by
Bluse James H
Purchase Details
Closed on
Jul 1, 2009
Sold by
Meck Deborah
Bought by
Bluse James H
Purchase Details
Closed on
Jun 26, 2009
Sold by
Masters Nancie
Bought by
Bluse James H
Purchase Details
Closed on
May 7, 2009
Sold by
Bluse Nancy A -
Bought by
Bluse Steve and Bluse Jim
Purchase Details
Closed on
Jan 22, 2008
Sold by
Yun Song
Bought by
Harper Kimberly R
Purchase Details
Closed on
Oct 29, 2004
Sold by
Harper Kimberly R
Bought by
Bluse James and Bluse Nancy
Purchase Details
Closed on
Oct 7, 2003
Sold by
Harper Kimberly R and Yun Song
Bought by
Capital Mortgage Corporation
Purchase Details
Closed on
Jun 21, 1991
Bought by
Harper Kimberly R
Purchase Details
Closed on
Aug 20, 1990
Bought by
Harper Kimberly R
Purchase Details
Closed on
May 15, 1985
Bought by
Harper Kimberly R
Create a Home Valuation Report for This Property
The Home Valuation Report is an in-depth analysis detailing your home's value as well as a comparison with similar homes in the area
Home Values in the Area
Average Home Value in this Area
Purchase History
| Date | Buyer | Sale Price | Title Company |
|---|---|---|---|
| Velasco Samantha | $210,000 | -- | |
| Bluse James H | -- | -- | |
| Bluse James H | -- | -- | |
| Bluse James H | -- | -- | |
| Bluse James H | -- | -- | |
| Bluse James H | -- | -- | |
| Bluse James H | -- | -- | |
| Bluse James H | -- | -- | |
| Bluse James H | -- | -- | |
| Bluse Steve | -- | -- | |
| Harper Kimberly R | -- | -- | |
| Bluse James | -- | -- | |
| Capital Mortgage Corporation | -- | -- | |
| Capital Mtg Corp | $10,000 | -- | |
| Harper Kimberly R | -- | -- | |
| Harper Kimberly R | -- | -- | |
| Harper Kimberly R | $11,500 | -- |
Source: Public Records
Tax History Compared to Growth
Tax History
| Year | Tax Paid | Tax Assessment Tax Assessment Total Assessment is a certain percentage of the fair market value that is determined by local assessors to be the total taxable value of land and additions on the property. | Land | Improvement |
|---|---|---|---|---|
| 2024 | $2,646 | $91,520 | $11,240 | $80,280 |
| 2023 | $2,300 | $78,560 | $10,040 | $68,520 |
| 2022 | $2,210 | $74,520 | $10,040 | $64,480 |
| 2021 | $2,136 | $61,880 | $10,040 | $51,840 |
| 2020 | $2,192 | $63,680 | $10,040 | $53,640 |
| 2019 | $2,230 | $64,560 | $10,040 | $54,520 |
| 2018 | $2,240 | $64,560 | $10,040 | $54,520 |
| 2017 | $2,250 | $64,560 | $10,040 | $54,520 |
| 2016 | $2,241 | $64,560 | $10,040 | $54,520 |
| 2015 | $2,244 | $64,560 | $10,040 | $54,520 |
| 2014 | $2,248 | $64,560 | $10,040 | $54,520 |
| 2013 | -- | $64,560 | $10,040 | $54,520 |
Source: Public Records
Map
Nearby Homes
- 274 Kelli Dr
- Lot 5 Trojan Way
- Lot 6 Trojan Way
- Lot 2 Trojan Way
- Lot 1 Trojan Way
- 104 King Arthurs Ct
- 1646 E Wesley Chapel Rd
- 35 Falcon Crest Way
- 125 Peregrine Dr
- 510 Southland Trail
- 408 Dixieland Dr
- 165 Lakeview Rd
- 555 Kimberly Dr
- 302 Southland Trail
- 0 Barker Rd Unit 243030
- 0 Barker Rd Unit 14258525
- 0 Barker Rd Unit 175053
- 39 English Ct
- 2246 Burnett Rd
- 254 Shantz Way Unit (LOT A44)