Estimated Value: $372,000 - $564,000
3
Beds
2
Baths
1,456
Sq Ft
$312/Sq Ft
Est. Value
About This Home
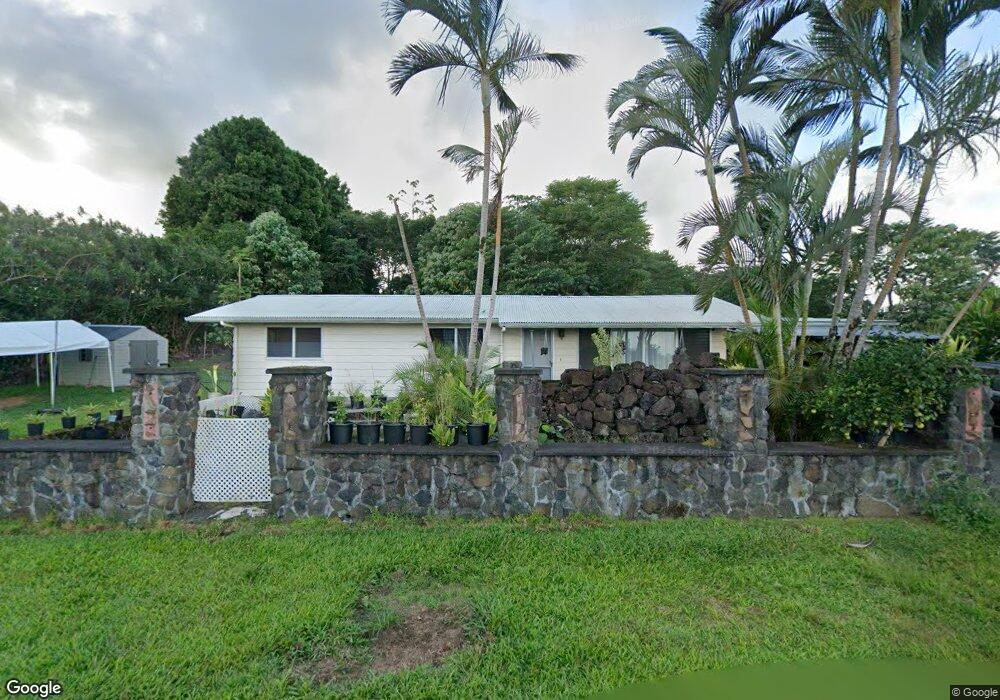
This home is located at 170 Laula Rd, Hilo, HI 96720 and is currently estimated at $454,759, approximately $312 per square foot. 170 Laula Rd is a home located in Hawaii County with nearby schools including Waiakeawaena Elementary School, Waiakea Intermediate School, and Waiakea High School.
Ownership History
Date
Name
Owned For
Owner Type
Purchase Details
Closed on
Mar 17, 2025
Sold by
170 Laula Road Llc
Bought by
Drescher Allen Jonas
Current Estimated Value
Home Financials for this Owner
Home Financials are based on the most recent Mortgage that was taken out on this home.
Original Mortgage
$320,000
Outstanding Balance
$318,368
Interest Rate
6.89%
Mortgage Type
New Conventional
Estimated Equity
$136,391
Purchase Details
Closed on
Feb 4, 2021
Sold by
Oleary Paul Stephen and Oleary Soo Yang
Bought by
170 Laula Road Llc
Create a Home Valuation Report for This Property
The Home Valuation Report is an in-depth analysis detailing your home's value as well as a comparison with similar homes in the area
Home Values in the Area
Average Home Value in this Area
Purchase History
| Date | Buyer | Sale Price | Title Company |
|---|---|---|---|
| Drescher Allen Jonas | -- | Title Guaranty | |
| Drescher Allen Jonas | -- | Title Guaranty | |
| 170 Laula Road Llc | $1,000 | None Available |
Source: Public Records
Mortgage History
| Date | Status | Borrower | Loan Amount |
|---|---|---|---|
| Open | Drescher Allen Jonas | $320,000 | |
| Closed | Drescher Allen Jonas | $320,000 |
Source: Public Records
Tax History
| Year | Tax Paid | Tax Assessment Tax Assessment Total Assessment is a certain percentage of the fair market value that is determined by local assessors to be the total taxable value of land and additions on the property. | Land | Improvement |
|---|---|---|---|---|
| 2025 | $4,730 | $456,200 | $207,200 | $249,000 |
| 2024 | $4,730 | $426,100 | $188,000 | $238,100 |
| 2023 | $4,408 | $397,100 | $175,700 | $221,400 |
| 2022 | $2,277 | $370,300 | $148,900 | $221,400 |
| 2021 | $3,706 | $333,900 | $142,200 | $191,700 |
| 2020 | $3,514 | $316,600 | $134,100 | $182,500 |
| 2019 | $3,398 | $306,100 | $128,700 | $177,400 |
| 2018 | $3,027 | $272,700 | $128,700 | $144,000 |
| 2017 | $2,890 | $260,400 | $121,900 | $138,500 |
| 2016 | $2,522 | $250,900 | $115,200 | $135,700 |
| 2015 | -- | $224,500 | $99,200 | $125,300 |
| 2014 | -- | $226,600 | $99,200 | $127,400 |
Source: Public Records
Map
Nearby Homes
- 39 Laula Rd
- 29 Laula Rd
- 3047 Lou St
- 508 Ekela St
- 2615 Kinoole St
- 2557 Kinoole St
- 114 Hale Manu Dr
- 2501 Kinoole St
- 2669 Kilauea Ave
- 110 Malia St
- 411 Ainaola Dr
- 99 Elm Dr
- 2501 Kilauea Ave
- 595 W Kawailani St
- 126 W Kinai Place
- 2244 Kinoole St
- 89 W Kawailani St
- 346 Kanoelani St
- 347 Nohea St
- 75 E Palai St
Your Personal Tour Guide
Ask me questions while you tour the home.