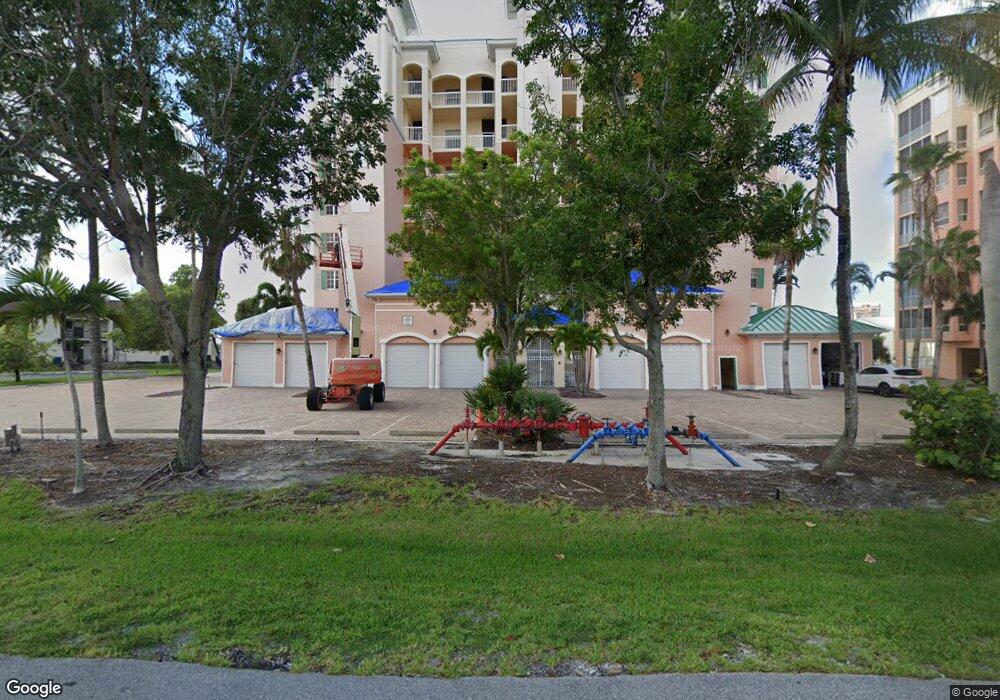
Palm Harbor Club East and West 170 Lenell Rd Unit 504 Fort Myers Beach, FL 33931
Estimated Value: $299,187 - $853,000
2
Beds
2
Baths
1,663
Sq Ft
$380/Sq Ft
Est. Value
About This Home
This home is located at 170 Lenell Rd Unit 504, Fort Myers Beach, FL 33931 and is currently estimated at $631,297, approximately $379 per square foot. 170 Lenell Rd Unit 504 is a home located in Lee County with nearby schools including Fort Myers Beach Elementary School, Bonita Springs Middle Center for the Arts, and Cypress Lake Middle School.
Ownership History
Date
Name
Owned For
Owner Type
Purchase Details
Closed on
Dec 15, 2021
Sold by
Long Tracy
Bought by
Bertholet Kelly
Current Estimated Value
Purchase Details
Closed on
Sep 23, 2017
Sold by
Bertholet Edward R
Bought by
Bertholet Edward R and Edward R Bertholet Irrevocable Trust
Purchase Details
Closed on
Jan 18, 2017
Sold by
Bertholet Edward R
Bought by
Bertholet Edward R and Edward R Bertholet Revocable Trust
Purchase Details
Closed on
Aug 31, 2004
Sold by
Bertholet Edward R
Bought by
Bertholet Edward R and Edward R Bertholet Revocable Trust
Purchase Details
Closed on
Dec 28, 2000
Sold by
Ostego Harbor Club Co Ltd
Bought by
Mann Dennis G
Home Financials for this Owner
Home Financials are based on the most recent Mortgage that was taken out on this home.
Original Mortgage
$214,534
Interest Rate
7.75%
Create a Home Valuation Report for This Property
The Home Valuation Report is an in-depth analysis detailing your home's value as well as a comparison with similar homes in the area
Home Values in the Area
Average Home Value in this Area
Purchase History
| Date | Buyer | Sale Price | Title Company |
|---|---|---|---|
| Bertholet Kelly | $300,000 | Accommodation | |
| Bertholet Kelly | $100 | None Listed On Document | |
| Bertholet Edward R | -- | Attorney | |
| Bertholet Edward R | -- | Attorney | |
| Bertholet Edward R | -- | -- | |
| Mann Dennis G | $286,100 | -- |
Source: Public Records
Mortgage History
| Date | Status | Borrower | Loan Amount |
|---|---|---|---|
| Previous Owner | Mann Dennis G | $214,534 |
Source: Public Records
Tax History Compared to Growth
Tax History
| Year | Tax Paid | Tax Assessment Tax Assessment Total Assessment is a certain percentage of the fair market value that is determined by local assessors to be the total taxable value of land and additions on the property. | Land | Improvement |
|---|---|---|---|---|
| 2025 | $512 | $686,294 | -- | $686,294 |
| 2024 | $459 | $35,237 | -- | $32,034 |
| 2023 | $459 | $32,034 | $0 | $32,034 |
| 2022 | $8,382 | $600,345 | $0 | $600,345 |
| 2021 | $4,622 | $468,911 | $0 | $468,911 |
| 2020 | $4,665 | $343,036 | $0 | $0 |
| 2019 | $4,585 | $335,324 | $0 | $0 |
| 2018 | $4,426 | $329,072 | $0 | $0 |
| 2017 | $4,421 | $322,304 | $0 | $0 |
| 2016 | $4,398 | $462,346 | $0 | $462,346 |
| 2015 | $4,450 | $402,100 | $0 | $402,100 |
| 2014 | $4,466 | $340,380 | $0 | $340,380 |
| 2013 | -- | $348,530 | $0 | $348,530 |
Source: Public Records
About Palm Harbor Club East and West
Map
Nearby Homes
- 170 Lenell Rd Unit 202
- 170 Lenell Rd Unit 501
- 170 Lenell Rd Unit 403
- 150 Lenell Rd Unit 801
- 200 Lenell Rd Unit 214
- 200 Lenell Rd Unit 324
- 200 Lenell Rd Unit 215
- 221 Lenell Rd Unit 5A
- 271 Lenell Rd Unit 6D
- 6891 Estero Blvd Unit 362
- 4531 Bay Beach Ln Unit 333
- 4531 Bay Beach Ln Unit 334
- 281 Lenell Rd Unit 1 (7-A)
- 4431 Bay Beach Ln Unit 543
- 6893 Estero Blvd Unit 416
- 6893 Estero Blvd Unit 425
- 4481 Bay Beach Ln Unit 214
- 4481 Bay Beach Ln Unit 224
- 7000 Estero Blvd Unit 205
- 22652 Island Pines Way Unit 154
- 170 Lenell Rd Unit 702
- 170 Lenell Rd Unit 602
- 170 Lenell Rd Unit 303
- 170 Lenell Rd Unit 703
- 170 Lenell Rd Unit 802
- 170 Lenell Rd Unit 301
- 170 Lenell Rd Unit 502
- 170 Lenell Rd Unit 601
- 170 Lenell Rd Unit 402
- 170 Lenell Rd Unit 801
- 170 Lenell Rd Unit 302
- 170 Lenell Rd Unit 304
- 170 Lenell Rd Unit 201
- 170 Lenell Rd Unit 401
- 170 Lenell Rd Unit 503
- 170 Lenell Rd Unit 404
- 170 Lenell Rd Unit 603
- 170 Lenell Rd Unit 701
- 170 Lenell Rd Unit 204
- 170 Lenell Rd Unit 804