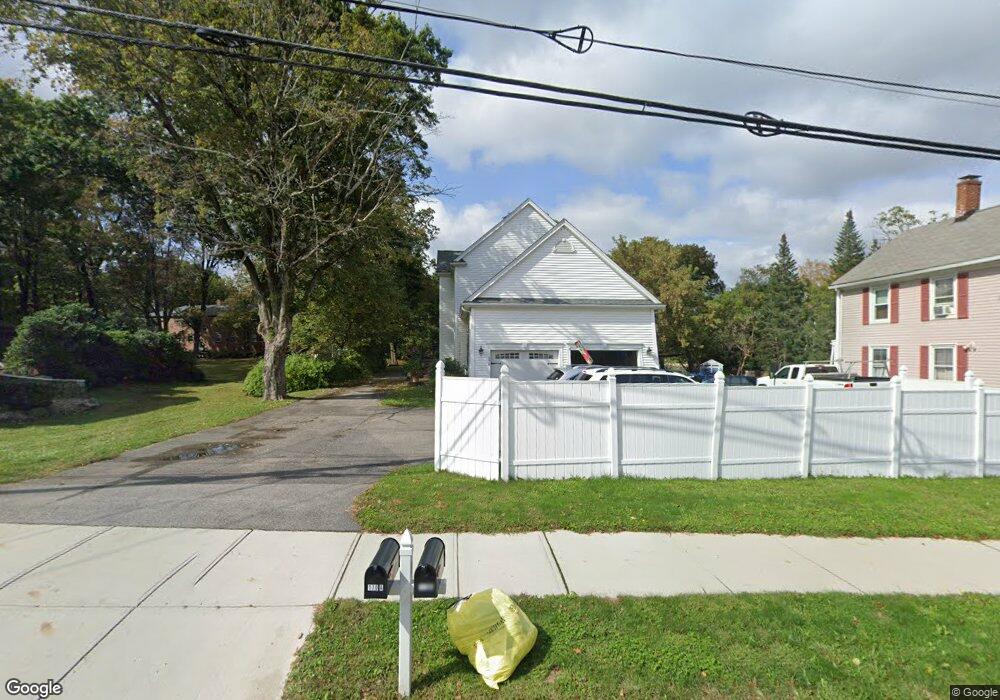
170 Main St Unit B Medway, MA 02053
Estimated Value: $595,000 - $701,000
4
Beds
3
Baths
2,000
Sq Ft
$324/Sq Ft
Est. Value
About This Home
This home is located at 170 Main St Unit B, Medway, MA 02053 and is currently estimated at $647,400, approximately $323 per square foot. 170 Main St Unit B is a home located in Norfolk County with nearby schools including John D. McGovern Elementary School, Burke-Memorial Elementary, and Medway Middle School.
Ownership History
Date
Name
Owned For
Owner Type
Purchase Details
Closed on
Oct 30, 2017
Sold by
Huffam Richard R Est
Bought by
Coletti Michael P and Coletti Isabel M
Current Estimated Value
Home Financials for this Owner
Home Financials are based on the most recent Mortgage that was taken out on this home.
Original Mortgage
$309,430
Outstanding Balance
$257,558
Interest Rate
3.78%
Mortgage Type
New Conventional
Estimated Equity
$389,842
Purchase Details
Closed on
Dec 10, 2010
Sold by
Old New England Bldrs
Bought by
Huffman Richard R and Denommee Mark S
Home Financials for this Owner
Home Financials are based on the most recent Mortgage that was taken out on this home.
Original Mortgage
$289,500
Interest Rate
4.24%
Mortgage Type
Purchase Money Mortgage
Purchase Details
Closed on
Mar 2, 2007
Sold by
Denommee Mark S and Huffam Richard R
Bought by
Old New England Bldrs
Create a Home Valuation Report for This Property
The Home Valuation Report is an in-depth analysis detailing your home's value as well as a comparison with similar homes in the area
Home Values in the Area
Average Home Value in this Area
Purchase History
| Date | Buyer | Sale Price | Title Company |
|---|---|---|---|
| Coletti Michael P | $319,000 | -- | |
| Huffman Richard R | -- | -- | |
| Huffman Richard R | -- | -- | |
| Huffman Richard R | -- | -- | |
| Old New England Bldrs | -- | -- | |
| Denommee Mark S | -- | -- | |
| Old New England Bldrs | -- | -- | |
| Old New England Bldrs | -- | -- | |
| Denommee Mark S | -- | -- |
Source: Public Records
Mortgage History
| Date | Status | Borrower | Loan Amount |
|---|---|---|---|
| Open | Coletti Michael P | $309,430 | |
| Closed | Old New England Bldrs | $309,430 | |
| Previous Owner | Huffman Richard R | $289,500 |
Source: Public Records
Tax History Compared to Growth
Tax History
| Year | Tax Paid | Tax Assessment Tax Assessment Total Assessment is a certain percentage of the fair market value that is determined by local assessors to be the total taxable value of land and additions on the property. | Land | Improvement |
|---|---|---|---|---|
| 2025 | $6,361 | $446,400 | $0 | $446,400 |
| 2024 | $6,428 | $446,400 | $0 | $446,400 |
| 2023 | $7,401 | $464,300 | $0 | $464,300 |
| 2022 | $7,297 | $431,000 | $0 | $431,000 |
| 2021 | $7,316 | $419,000 | $0 | $419,000 |
| 2020 | $6,314 | $360,800 | $0 | $360,800 |
| 2019 | $4,628 | $272,700 | $0 | $272,700 |
| 2018 | $4,816 | $272,700 | $0 | $272,700 |
| 2017 | $4,887 | $272,700 | $0 | $272,700 |
| 2016 | $4,939 | $272,700 | $0 | $272,700 |
| 2015 | $4,974 | $272,700 | $0 | $272,700 |
| 2014 | $6,140 | $325,900 | $0 | $325,900 |
Source: Public Records
Map
Nearby Homes
- 176 Main St Unit 3
- 28 Wellington St
- 5 Fales St
- 220 Main St Unit 220
- 6 Freedom Trail
- 280 Village St Unit D2
- 4 Shaw St
- 14 Heritage Dr
- 22 Sunset Dr
- 21 Riverside Rd
- 36 Lovering St
- 12 Lovering St
- 3 Meryl St
- 106 Holliston St
- 39 West St
- 18 Mary Anne Dr
- 12 Longmeadow Ln
- 462 Hartford Ave
- 50 Main St
- 455 Hartford Ave
- 170 Main St Unit A
- 170 Main St
- 168 Main St
- 172 Main St
- 16 Mechanic St Unit 5
- 14 Mechanic St Unit 6
- 14 Mechanic St Unit 3`
- 169 Main St
- 169 Main St Unit 101
- 174B Main St
- 174 Main St Unit B
- 171 Main St
- 167 Main St
- 173 Main St Unit b
- 173 Main St
- 173 Main St
- 173 Main St Unit 1
- 173 Main St Unit 2
- 176 Main St
- 176 Main St Unit 4