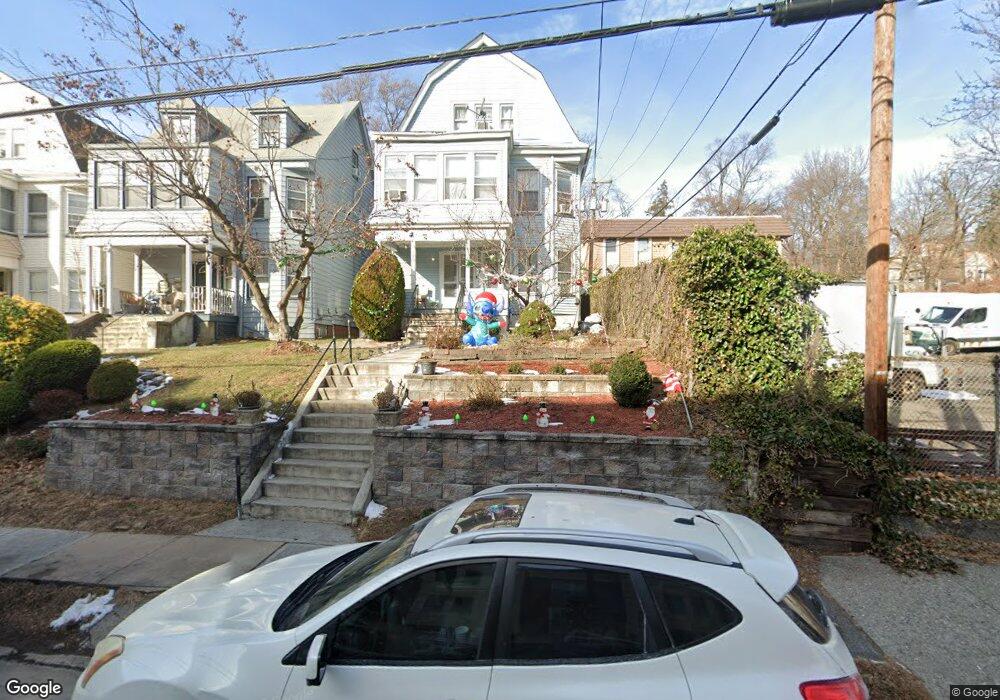
170 Main St West Orange, NJ 07052
Estimated Value: $527,000 - $696,000
--
Bed
--
Bath
1,992
Sq Ft
$309/Sq Ft
Est. Value
About This Home
This home is located at 170 Main St, West Orange, NJ 07052 and is currently estimated at $614,558, approximately $308 per square foot. 170 Main St is a home located in Essex County with nearby schools including West Orange High School and Mount Carmel Guild Academy.
Ownership History
Date
Name
Owned For
Owner Type
Purchase Details
Closed on
Apr 4, 2001
Sold by
Jairam Sungrim
Bought by
Flores Jose
Current Estimated Value
Home Financials for this Owner
Home Financials are based on the most recent Mortgage that was taken out on this home.
Original Mortgage
$235,142
Outstanding Balance
$85,779
Interest Rate
6.88%
Mortgage Type
FHA
Estimated Equity
$528,779
Purchase Details
Closed on
Sep 29, 1998
Sold by
Spina Anthony
Bought by
Sugrim Sairam and Sugrim Cholamari
Home Financials for this Owner
Home Financials are based on the most recent Mortgage that was taken out on this home.
Original Mortgage
$168,047
Interest Rate
6.89%
Mortgage Type
FHA
Purchase Details
Closed on
Sep 1, 1988
Sold by
Letty Zalme Case
Bought by
Spina Anthony C
Create a Home Valuation Report for This Property
The Home Valuation Report is an in-depth analysis detailing your home's value as well as a comparison with similar homes in the area
Home Values in the Area
Average Home Value in this Area
Purchase History
| Date | Buyer | Sale Price | Title Company |
|---|---|---|---|
| Flores Jose | $237,000 | -- | |
| Sugrim Sairam | $173,000 | -- | |
| Spina Anthony C | $199,000 | -- |
Source: Public Records
Mortgage History
| Date | Status | Borrower | Loan Amount |
|---|---|---|---|
| Open | Flores Jose | $235,142 | |
| Previous Owner | Sugrim Sairam | $168,047 |
Source: Public Records
Tax History Compared to Growth
Tax History
| Year | Tax Paid | Tax Assessment Tax Assessment Total Assessment is a certain percentage of the fair market value that is determined by local assessors to be the total taxable value of land and additions on the property. | Land | Improvement |
|---|---|---|---|---|
| 2025 | $11,348 | $567,100 | $209,400 | $357,700 |
| 2024 | $11,348 | $246,800 | $57,400 | $189,400 |
| 2022 | $10,951 | $246,800 | $57,400 | $189,400 |
| 2021 | $10,746 | $246,800 | $57,400 | $189,400 |
| 2020 | $10,573 | $246,800 | $57,400 | $189,400 |
| 2019 | $10,269 | $246,800 | $57,400 | $189,400 |
| 2018 | $9,966 | $246,800 | $57,400 | $189,400 |
| 2017 | $9,837 | $246,800 | $57,400 | $189,400 |
| 2016 | $9,601 | $246,800 | $57,400 | $189,400 |
| 2015 | $9,420 | $246,800 | $57,400 | $189,400 |
| 2014 | $9,235 | $246,800 | $57,400 | $189,400 |
Source: Public Records
Map
Nearby Homes