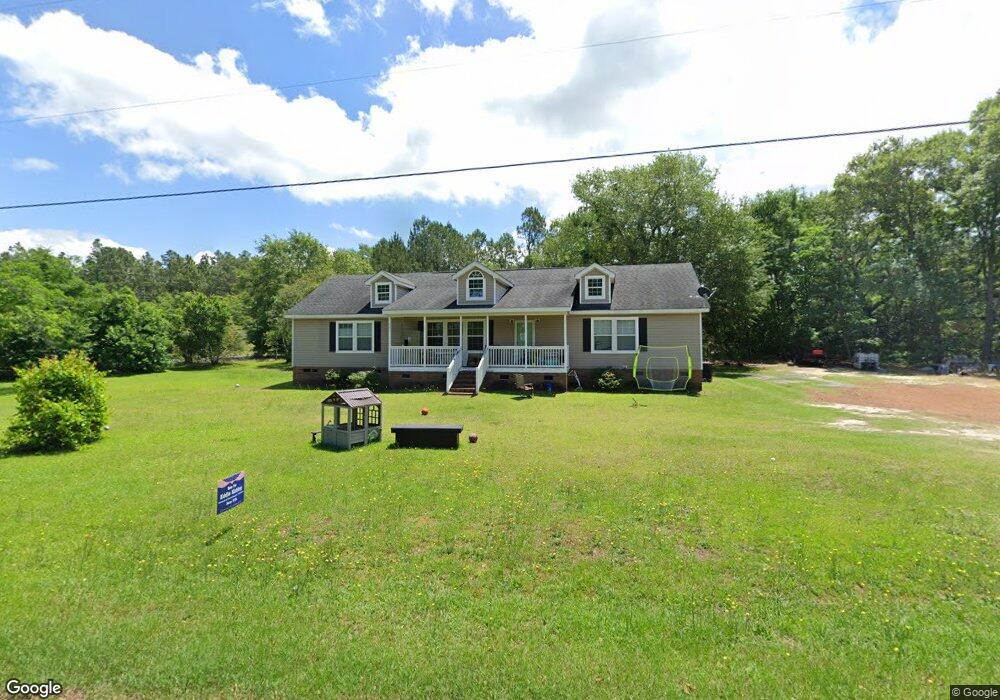
170 N 8th St Mc Bee, SC 29101
Estimated Value: $165,378 - $313,000
3
Beds
2
Baths
1,878
Sq Ft
$124/Sq Ft
Est. Value
About This Home
This home is located at 170 N 8th St, Mc Bee, SC 29101 and is currently estimated at $232,845, approximately $123 per square foot. 170 N 8th St is a home located in Chesterfield County with nearby schools including McBee Elementary School, McBee High School, and New Heights Middle School.
Ownership History
Date
Name
Owned For
Owner Type
Purchase Details
Closed on
Jan 3, 2012
Sold by
The Secretary Of Housing And Urban Devel
Bought by
Johnson Crystal S
Current Estimated Value
Home Financials for this Owner
Home Financials are based on the most recent Mortgage that was taken out on this home.
Original Mortgage
$77,467
Outstanding Balance
$53,790
Interest Rate
4.25%
Mortgage Type
FHA
Estimated Equity
$179,055
Purchase Details
Closed on
Sep 14, 2010
Sold by
Lear Jeremy and Lear Jessica
Bought by
Secretary Of Hud
Purchase Details
Closed on
Jun 24, 2008
Sold by
Welch Teresa C
Bought by
Lear Jeremy and Lear Jessica
Home Financials for this Owner
Home Financials are based on the most recent Mortgage that was taken out on this home.
Original Mortgage
$180,000
Interest Rate
5.97%
Mortgage Type
New Conventional
Purchase Details
Closed on
Aug 30, 2006
Sold by
Estate Of Carl Kenneth Welch
Bought by
Welch Teresa C
Create a Home Valuation Report for This Property
The Home Valuation Report is an in-depth analysis detailing your home's value as well as a comparison with similar homes in the area
Home Values in the Area
Average Home Value in this Area
Purchase History
| Date | Buyer | Sale Price | Title Company |
|---|---|---|---|
| Johnson Crystal S | $76,800 | None Available | |
| Secretary Of Hud | $2,500 | -- | |
| Lear Jeremy | $15,000 | -- | |
| Welch Teresa C | -- | -- |
Source: Public Records
Mortgage History
| Date | Status | Borrower | Loan Amount |
|---|---|---|---|
| Open | Johnson Crystal S | $77,467 | |
| Previous Owner | Lear Jeremy | $180,000 |
Source: Public Records
Tax History Compared to Growth
Tax History
| Year | Tax Paid | Tax Assessment Tax Assessment Total Assessment is a certain percentage of the fair market value that is determined by local assessors to be the total taxable value of land and additions on the property. | Land | Improvement |
|---|---|---|---|---|
| 2024 | $683 | $5,250 | $200 | $5,050 |
| 2023 | $656 | $5,250 | $200 | $5,050 |
| 2022 | $694 | $5,250 | $200 | $5,050 |
| 2021 | $615 | $5,250 | $200 | $5,050 |
| 2020 | $683 | $5,250 | $200 | $5,050 |
| 2019 | $2,160 | $5,210 | $160 | $5,050 |
| 2018 | $2,118 | $5,210 | $160 | $5,050 |
| 2015 | $646 | $5,210 | $160 | $5,050 |
| 2014 | $816 | $5,210 | $160 | $5,050 |
| 2010 | -- | $10,160 | $900 | $9,260 |
Source: Public Records
Map
Nearby Homes
- 255 N 9th St
- Lot 30 Norwood Farms
- Lot 25 Norwood Farms
- Lot 32 Norwood Farms
- Lot 34 Norwood Farms
- Lot 28 Norwood Farm
- Lot 38 Norwood Farms
- Lot 36 Norwood Farms
- Lot 26 Norwood Farms
- 336 N 9th St
- 0 Us Highway 1 South Seventh St Unit 20223111
- 25560 S Carolina 151
- Lot 9-14 Maple Ave
- Lot 15 & 16 Maple Ave
- 000 Overflow Rd
- 2442 New Hope Church Rd
- 165 Forest Dr
- 3929 Timrod Rd
- 2117 & 2109 Togetherness Way
- 3048 Timrod Rd