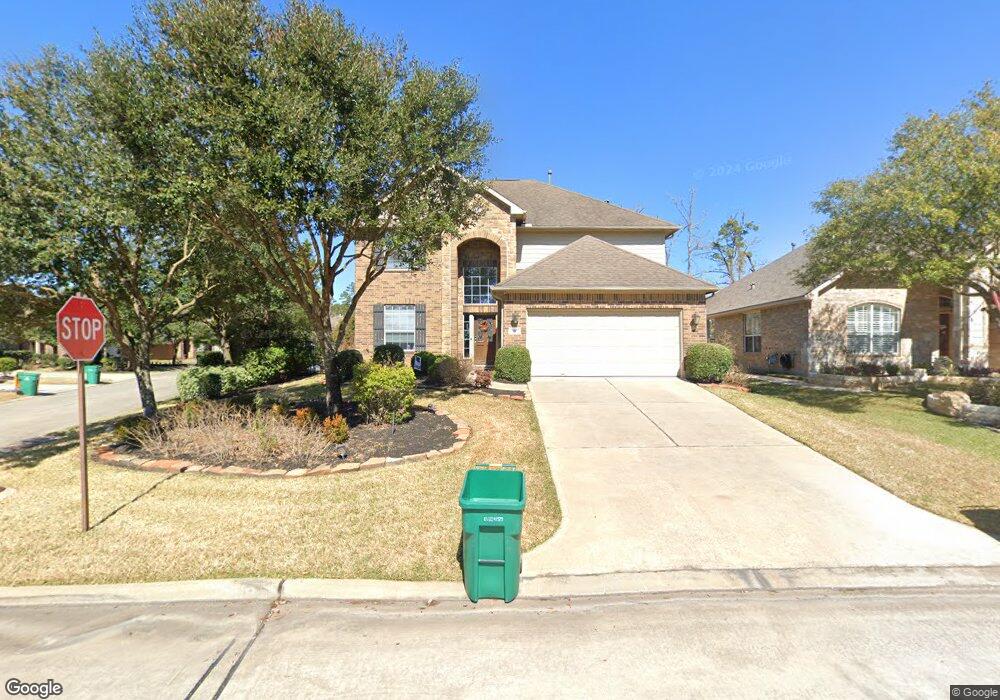
170 N Hawkhurst Cir Magnolia, TX 77354
Estimated Value: $438,655 - $453,000
--
Bed
3
Baths
2,401
Sq Ft
$185/Sq Ft
Est. Value
About This Home
This home is located at 170 N Hawkhurst Cir, Magnolia, TX 77354 and is currently estimated at $444,414, approximately $185 per square foot. 170 N Hawkhurst Cir is a home located in Montgomery County with nearby schools including Cedric C Smith, Bear Branch Junior High School, and Magnolia High School.
Ownership History
Date
Name
Owned For
Owner Type
Purchase Details
Closed on
Mar 13, 2015
Sold by
Dobitz Leo J and Dobitz Dianne R
Bought by
Robison Clayton and Robison Timari M
Current Estimated Value
Home Financials for this Owner
Home Financials are based on the most recent Mortgage that was taken out on this home.
Original Mortgage
$232,000
Outstanding Balance
$177,168
Interest Rate
3.68%
Mortgage Type
New Conventional
Estimated Equity
$267,246
Purchase Details
Closed on
May 26, 2009
Sold by
Lennar Homes Of Texas Sales & Marketing
Bought by
Dobitz Leo J and Dobitz Dianne R
Home Financials for this Owner
Home Financials are based on the most recent Mortgage that was taken out on this home.
Original Mortgage
$202,838
Interest Rate
4.72%
Mortgage Type
FHA
Purchase Details
Closed on
Dec 24, 2008
Sold by
Woodlands Land Dev Lp
Bought by
Robison Clayton and Robison Timari M
Create a Home Valuation Report for This Property
The Home Valuation Report is an in-depth analysis detailing your home's value as well as a comparison with similar homes in the area
Home Values in the Area
Average Home Value in this Area
Purchase History
| Date | Buyer | Sale Price | Title Company |
|---|---|---|---|
| Robison Clayton | -- | Great American Title | |
| Dobitz Leo J | -- | North American Title Company | |
| Robison Clayton | -- | -- |
Source: Public Records
Mortgage History
| Date | Status | Borrower | Loan Amount |
|---|---|---|---|
| Open | Robison Clayton | $232,000 | |
| Previous Owner | Dobitz Leo J | $202,838 |
Source: Public Records
Tax History Compared to Growth
Tax History
| Year | Tax Paid | Tax Assessment Tax Assessment Total Assessment is a certain percentage of the fair market value that is determined by local assessors to be the total taxable value of land and additions on the property. | Land | Improvement |
|---|---|---|---|---|
| 2025 | $6,705 | $424,589 | -- | -- |
| 2024 | $6,026 | $385,990 | -- | -- |
| 2023 | $6,026 | $350,900 | $60,000 | $336,480 |
| 2022 | $7,511 | $319,000 | $60,000 | $300,750 |
| 2021 | $7,172 | $290,000 | $28,250 | $261,750 |
| 2020 | $7,335 | $278,080 | $28,250 | $249,830 |
| 2019 | $7,710 | $284,900 | $28,250 | $256,650 |
| 2018 | $6,630 | $268,390 | $28,250 | $240,140 |
| 2017 | $7,643 | $279,400 | $28,250 | $251,150 |
| 2016 | $7,786 | $284,620 | $28,250 | $256,370 |
| 2015 | $6,241 | $290,660 | $28,250 | $270,200 |
| 2014 | $6,241 | $264,240 | $28,250 | $238,640 |
Source: Public Records
Map
Nearby Homes
- 166 Hawkhurst Cir
- 163 N Hawkhurst Cir
- 2 Craven Park Ct
- 30 Black Swan Ct
- 115 Black Swan Place
- 35 N Star Ridge Cir
- 10 Barker Ridge Ct
- 158 S Star Ridge Cir
- 146 S Star Ridge Cir
- 207 N Vershire Cir
- 119 Benedict Canyon Loop
- 51 N Scribewood Cir
- 10 Heirloom Garden Place
- 66 Hearthshire Cir
- 30 N Scribewood Cir
- 78 S Bardsbrook Cir
- 14 Trailing Lantana Place
- 16 Florentino Vine Place
- 31 N Spinning Wheel Cir
- 175 N Almondell Way
- 170 Hawkhurst Cir
- 168 Hawkhurst Cir
- 63 Quillwood Place
- 67 Quillwood Place
- 71 Quillwood Place
- 171 Hawkhurst Cir
- 167 Hawkhurst Cir
- 75 Quillwood Place
- 162 Hawkhurst Cir
- 102 N Hawkhurst Cir
- 98 N Hawkhurst Cir
- 110 N Hawkhurst Cir
- 59 Quillwood Place
- 158 Hawkhurst Cir
- 114 N Hawkhurst Cir
- 106 N Hawkhurst Cir
- 163 Hawkhurst Cir
- 55 Quillwood Place
- 118 N Hawkhurst Cir
- 79 Quillwood Place