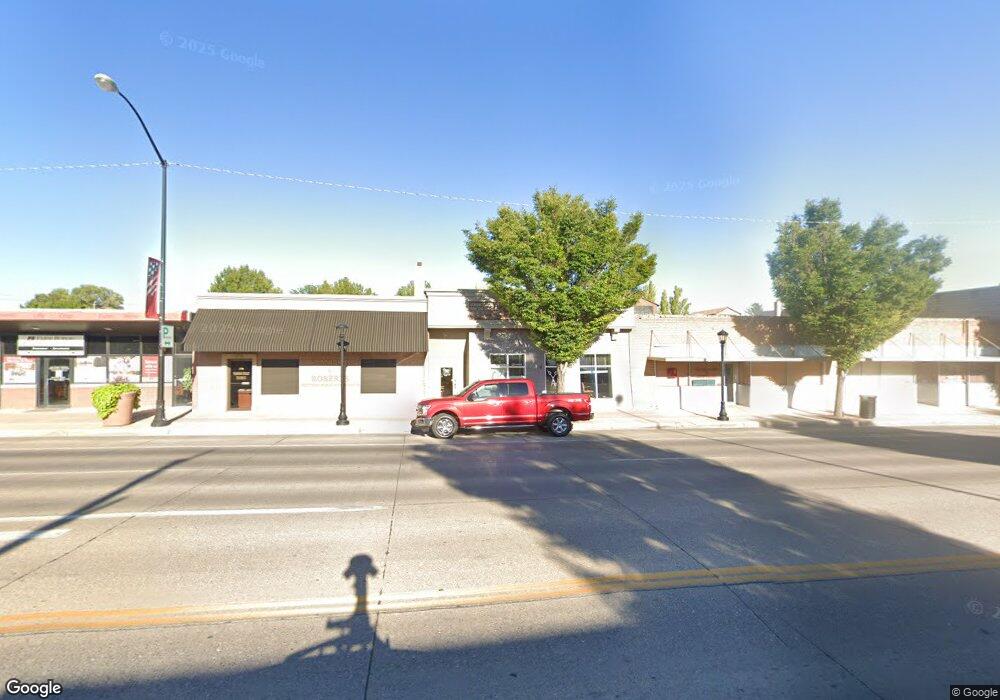
170 N Main St Richfield, UT 84701
Estimated Value: $317,639
Studio
--
Bath
3,000
Sq Ft
$106/Sq Ft
Est. Value
About This Home
This home is located at 170 N Main St, Richfield, UT 84701 and is currently estimated at $317,639, approximately $105 per square foot. 170 N Main St is a home located in Sevier County with nearby schools including Ashman School, Pahvant School, and Red Hills Middle School.
Ownership History
Date
Name
Owned For
Owner Type
Purchase Details
Closed on
Apr 23, 2018
Sold by
Allred Kristopher L and Allred Kristi P
Bought by
Horton Russell and Horton Octavia
Current Estimated Value
Home Financials for this Owner
Home Financials are based on the most recent Mortgage that was taken out on this home.
Original Mortgage
$153,678
Outstanding Balance
$130,504
Interest Rate
4.46%
Estimated Equity
$184,692
Purchase Details
Closed on
Sep 16, 2008
Sold by
Kunz David R
Bought by
Allred Kristopher L and Allred Kristi P
Home Financials for this Owner
Home Financials are based on the most recent Mortgage that was taken out on this home.
Original Mortgage
$122,570
Interest Rate
6.49%
Mortgage Type
Commercial
Create a Home Valuation Report for This Property
The Home Valuation Report is an in-depth analysis detailing your home's value as well as a comparison with similar homes in the area
Purchase History
We collect this data history from publicly available records. To have your information removed, we recommend requesting removal directly through your county’s website.
| Date | Buyer | Sale Price | Title Company |
|---|---|---|---|
| Horton Russell | -- | D Land Title | |
| Allred Kristopher L | -- | D Land Title |
Source: Public Records
Mortgage History
We collect this data history from publicly available records. To have your information removed, we recommend requesting removal directly through your county’s website.
| Date | Status | Borrower | Loan Amount |
|---|---|---|---|
| Open | Horton Russell | $153,678 | |
| Previous Owner | Allred Kristopher L | $122,570 |
Source: Public Records
Tax History
| Year | Tax Paid | Tax Assessment Tax Assessment Total Assessment is a certain percentage of the fair market value that is determined by local assessors to be the total taxable value of land and additions on the property. | Land | Improvement |
|---|---|---|---|---|
| 2025 | $1,976 | $203,557 | $45,878 | $157,679 |
| 2024 | $1,976 | $247,729 | $54,089 | $193,640 |
| 2023 | $2,451 | $242,520 | $48,880 | $193,640 |
| 2022 | $2,125 | $194,024 | $39,104 | $154,920 |
| 2021 | $2,393 | $183,886 | $28,966 | $154,920 |
| 2020 | $1,869 | $139,616 | $28,966 | $110,650 |
| 2019 | $1,765 | $139,610 | $28,960 | $110,650 |
| 2018 | $1,844 | $130,700 | $23,320 | $107,380 |
| 2017 | $1,932 | $130,700 | $23,320 | $107,380 |
| 2016 | -- | $130,700 | $0 | $0 |
| 2015 | -- | $130,700 | $0 | $0 |
| 2014 | -- | $130,700 | $0 | $0 |
Source: Public Records
Map
Nearby Homes
Your Personal Tour Guide
Ask me questions while you tour the home.