Estimated Value: $522,000 - $614,000
3
Beds
3
Baths
2,190
Sq Ft
$257/Sq Ft
Est. Value
About This Home
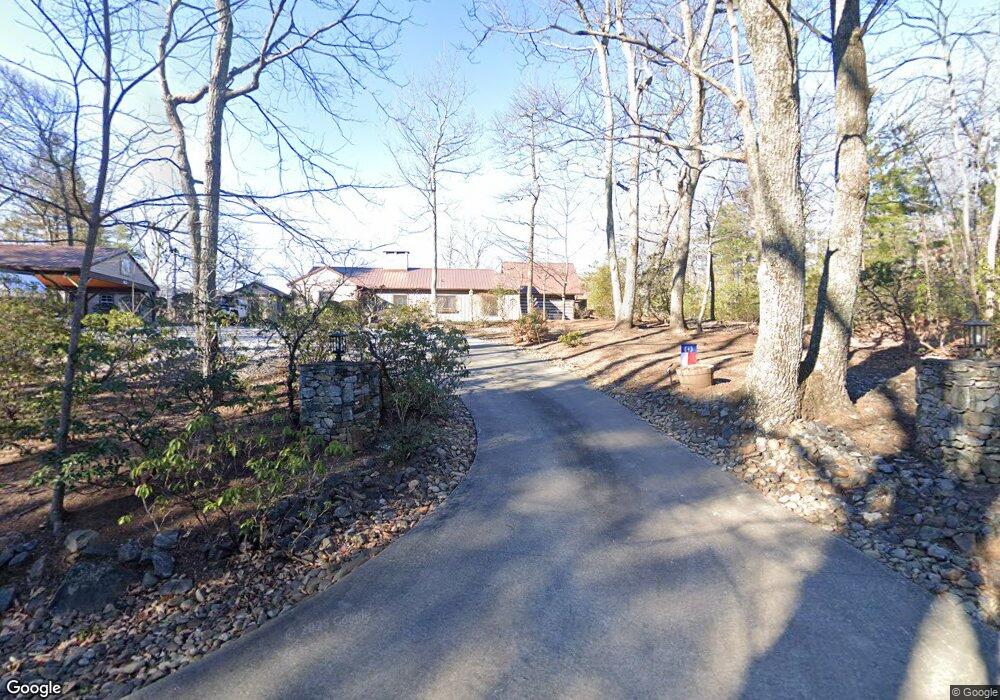
This home is located at 170 Overlook Cir, Tryon, NC 28782 and is currently estimated at $562,395, approximately $256 per square foot. 170 Overlook Cir is a home located in Polk County with nearby schools including Tryon Seventh-day Adventist School.
Ownership History
Date
Name
Owned For
Owner Type
Purchase Details
Closed on
Apr 14, 2009
Sold by
Skipper H Wayne H and Skipper Lela Jane
Bought by
Loyd Bryan and Loyd Laura L
Current Estimated Value
Home Financials for this Owner
Home Financials are based on the most recent Mortgage that was taken out on this home.
Original Mortgage
$291,179
Outstanding Balance
$184,763
Interest Rate
5.01%
Mortgage Type
Construction
Estimated Equity
$377,632
Purchase Details
Closed on
May 19, 2008
Sold by
Skipper H Wayne H and Skipper Lela Jaen
Bought by
Lane James D and Lane Carolyn B
Purchase Details
Closed on
Jan 14, 2005
Sold by
Stone Robert W and Stone Edith H
Bought by
Skipper H Wayne H and Skipper Lela Jane
Home Financials for this Owner
Home Financials are based on the most recent Mortgage that was taken out on this home.
Original Mortgage
$282,500
Interest Rate
5.71%
Mortgage Type
Future Advance Clause Open End Mortgage
Purchase Details
Closed on
Jul 7, 2004
Bought by
Loyd Bryan
Purchase Details
Closed on
Dec 31, 1997
Bought by
Loyd Bryan
Create a Home Valuation Report for This Property
The Home Valuation Report is an in-depth analysis detailing your home's value as well as a comparison with similar homes in the area
Home Values in the Area
Average Home Value in this Area
Purchase History
| Date | Buyer | Sale Price | Title Company |
|---|---|---|---|
| Loyd Bryan | $291,000 | None Available | |
| Lane James D | $5,000 | None Available | |
| Skipper H Wayne H | $283,000 | None Available | |
| Loyd Bryan | $175,000 | -- | |
| Loyd Bryan | -- | -- |
Source: Public Records
Mortgage History
| Date | Status | Borrower | Loan Amount |
|---|---|---|---|
| Open | Loyd Bryan | $291,179 | |
| Previous Owner | Skipper H Wayne H | $282,500 |
Source: Public Records
Tax History
| Year | Tax Paid | Tax Assessment Tax Assessment Total Assessment is a certain percentage of the fair market value that is determined by local assessors to be the total taxable value of land and additions on the property. | Land | Improvement |
|---|---|---|---|---|
| 2025 | $2,884 | $508,916 | $119,250 | $389,666 |
| 2024 | $2,783 | $391,197 | $101,325 | $289,872 |
| 2023 | $2,588 | $374,307 | $101,325 | $272,982 |
| 2022 | $2,511 | $374,307 | $101,325 | $272,982 |
| 2021 | $2,436 | $374,307 | $101,325 | $272,982 |
| 2020 | $1,994 | $280,738 | $78,825 | $201,913 |
| 2019 | $1,994 | $280,738 | $78,825 | $201,913 |
| 2018 | $1,906 | $280,738 | $78,825 | $201,913 |
| 2017 | $1,793 | $297,040 | $78,825 | $218,215 |
| 2016 | $1,899 | $297,040 | $78,825 | $218,215 |
| 2015 | $1,841 | $0 | $0 | $0 |
| 2014 | $1,782 | $0 | $0 | $0 |
| 2013 | -- | $0 | $0 | $0 |
Source: Public Records
Map
Nearby Homes
- 200 Piney Mountain Rd
- 225 Aurora Ln
- 56 Cardinal Cir
- 80 Laurel Ave
- 439 Lockhart Rd
- 34 Lockhart Rd
- 750 Braewick Rd
- 0 Green Creek Dr
- 50 Hidden Hill Rd
- 77 Chestnut St Unit 303
- 77 Chestnut St Unit Oak Hall 301
- 77 Chestnut St
- 160 E Howard St
- 15 Chestnut St
- 30 Porter St
- 305 Grady Ave
- 66 Fox Trot Ln
- 00 Fox Trot Ln
- 93 Villa Barbara Ln
- 160 Caledonia Rd
- 190 Overlook Cir
- 150 Overlook Cir
- 145 Overlook Cir
- 120 Overlook Cir
- 280 Overlook Cir
- 12 E Park Dr
- 1271 Hogback Mountain Rd
- P25-3 Overlook Trail
- 65.39 Ac Overlook Trail
- 230 Overlook Cir
- 218 Eastpark Dr
- 218 E Park Dr
- 2200 Carolina Dr
- 1313 Hogback Mountain Rd
- P25-4 Overlook Trail
- 1909 Carolina Dr
- 1240 Hogback Mountain Rd
- 2240 Carolina Dr
- 1225 Hogback Mountain Rd
- 0 Overhill Dr
Your Personal Tour Guide
Ask me questions while you tour the home.